|
![]()
| Decision tree learning Component1 #291942 Decision tree learning uses a decision tree as a predictive model which maps observations about an item to conclusions about the item's target value. It is one of the predictive modelling approaches used in statistics, data mining and machine learning. More descriptive names for such tree models are classification trees or regression trees. In these tree structures, leaves represent class labels and branches represent conjunctions of features that lead to those class labels. | Decision tree learningFrom Wikipedia, the free encyclopedia This article is about decision trees in machine learning. For the use of the term in decision analysis, see Decision tree. Decision tree learning uses a decision tree as a predictive model which maps observations about an item to conclusions about the item's target value. It is one of the predictive modelling approaches used in statistics, data mining and machine learning. More descriptive names for such tree models are classification trees or regression trees. In these tree structures, leavesrepresent class labels and branches represent conjunctions of features that lead to those class labels. In decision analysis, a decision tree can be used to visually and explicitly represent decisions and decision making. In data mining, a decision tree describes data but not decisions; rather the resulting classification tree can be an input for decision making. This page deals with decision trees in data mining. General[edit]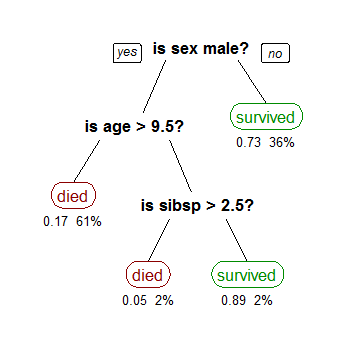 A tree showing survival of passengers on the Titanic ("sibsp" is the number of spouses or siblings aboard). The figures under the leaves show the probability of survival and the percentage of observations in the leaf. Decision tree learning is a method commonly used in data mining.[1] The goal is to create a model that predicts the value of a target variable based on several input variables. An example is shown on the right. Each interior node corresponds to one of the input variables; there are edges to children for each of the possible values of that input variable. Each leaf represents a value of the target variable given the values of the input variables represented by the path from the root to the leaf. A decision tree is a simple representation for classifying examples. Decision tree learning is one of the most successful techniques for supervised classification learning. For this section, assume that all of the features have finite discrete domains, and there is a single target feature called the classification. Each element of the domain of the classification is called a class. A decision tree or a classification tree is a tree in which each internal (non-leaf) node is labeled with an input feature. The arcs coming from a node labeled with a feature are labeled with each of the possible values of the feature. Each leaf of the tree is labeled with a class or a probability distribution over the classes. A tree can be "learned" by splitting the source set into subsets based on an attribute value test. This process is repeated on each derived subset in a recursive manner called recursive partitioning. The recursion is completed when the subset at a node has all the same value of the target variable, or when splitting no longer adds value to the predictions. This process of top-down induction of decision trees (TDIDT) [2] is an example of a greedy algorithm, and it is by far the most common strategy for learning decision trees from data. In data mining, decision trees can be described also as the combination of mathematical and computational techniques to aid the description, categorisation and generalisation of a given set of data. Data comes in records of the form:  The dependent variable, Y, is the target variable that we are trying to understand, classify or generalize. The vector x is composed of the input variables, x1, x2, x3 etc., that are used for that task. Decision trees used in data mining are of two main types: - Classification tree analysis is when the predicted outcome is the class to which the data belongs.
- Regression tree analysis is when the predicted outcome can be considered a real number (e.g. the price of a house, or a patient’s length of stay in a hospital).
The term Classification And Regression Tree (CART) analysis is an umbrella term used to refer to both of the above procedures, first introduced by Breiman et al.[3] Trees used for regression and trees used for classification have some similarities - but also some differences, such as the procedure used to determine where to split.[3] Some techniques, often called ensemble methods, construct more than one decision tree: - Bagging decision trees, an early ensemble method, builds multiple decision trees by repeatedly resampling training data with replacement, and voting the trees for a consensus prediction.[4]
- A Random Forest classifier uses a number of decision trees, in order to improve the classification rate.
- Boosted Trees can be used for regression-type and classification-type problems.[5][6]
- Rotation forest - in which every decision tree is trained by first applying principal component analysis (PCA) on a random subset of the input features.[7]
Decision tree learning is the construction of a decision tree from class-labeled training tuples. A decision tree is a flow-chart-like structure, where each internal (non-leaf) node denotes a test on an attribute, each branch represents the outcome of a test, and each leaf (or terminal) node holds a class label. The topmost node in a tree is the root node. There are many specific decision-tree algorithms. Notable ones include: - ID3 (Iterative Dichotomiser 3)
- C4.5 (successor of ID3)
- CART (Classification And Regression Tree)
- CHAID (CHi-squared Automatic Interaction Detector). Performs multi-level splits when computing classification trees.[8]
- MARS: extends decision trees to better handle numerical data.
ID3 and CART were invented independently at around same time (b/w 1970-80), yet follow a similar approach for learning decision tree from training tuples. Formulae[edit]Algorithms for constructing decision trees usually work top-down, by choosing a variable at each step that best splits the set of items.[9] Different algorithms use different metrics for measuring "best". These generally measure the homogeneity of the target variable within the subsets. Some examples are given below. These metrics are applied to each candidate subset, and the resulting values are combined (e.g., averaged) to provide a measure of the quality of the split. Gini impurity[edit]Used by the CART (classification and regression tree) algorithm, Gini impurity is a measure of how often a randomly chosen element from the set would be incorrectly labeled if it were randomly labeled according to the distribution of labels in the subset. Gini impurity can be computed by summing the probability of each item being chosen times the probability of a mistake in categorizing that item. It reaches its minimum (zero) when all cases in the node fall into a single target category. To compute Gini impurity for a set of items, suppose i takes on values in {1, 2, ..., m}, and let fi be the fraction of items labeled with value i in the set. 
Information gain[edit]Used by the ID3, C4.5 and C5.0 tree-generation algorithms. Information gain is based on the concept of entropy frominformation theory. 
Decision tree advantages[edit]Amongst other data mining methods, decision trees have various advantages: - Simple to understand and interpret. People are able to understand decision tree models after a brief explanation.
- Requires little data preparation. Other techniques often require data normalisation, dummy variables need to be created and blank values to be removed.
- Able to handle both numerical and categorical data. Other techniques are usually specialised in analysing datasets that have only one type of variable. (For example, relation rules can be used only with nominal variables while neural networks can be used only with numerical variables.)
- Uses a white box model. If a given situation is observable in a model the explanation for the condition is easily explained by boolean logic. (An example of a black box model is an artificial neural network since the explanation for the results is difficult to understand.)
- Possible to validate a model using statistical tests. That makes it possible to account for the reliability of the model.
- Robust. Performs well even if its assumptions are somewhat violated by the true model from which the data were generated.
- Performs well with large datasets. Large amounts of data can be analysed using standard computing resources in reasonable time.
Limitations[edit] - The problem of learning an optimal decision tree is known to be NP-complete under several aspects of optimality and even for simple concepts.[10][11] Consequently, practical decision-tree learning algorithms are based on heuristics such as the greedy algorithm where locally-optimal decisions are made at each node. Such algorithms cannot guarantee to return the globally-optimal decision tree.
- Decision-tree learners can create over-complex trees that do not generalise well from the training data. (This is known as overfitting.[12]) Mechanisms such as pruning are necessary to avoid this problem.
- There are concepts that are hard to learn because decision trees do not express them easily, such as XOR, parity ormultiplexer problems. In such cases, the decision tree becomes prohibitively large. Approaches to solve the problem involve either changing the representation of the problem domain (known as propositionalisation)[13] or using learning algorithms based on more expressive representations (such as statistical relational learning or inductive logic programming).
- For data including categorical variables with different numbers of levels, information gain in decision trees is biased in favor of those attributes with more levels.[14]
Extensions[edit]Decision graphs[edit]In a decision tree, all paths from the root node to the leaf node proceed by way of conjunction, or AND. In a decision graph, it is possible to use disjunctions (ORs) to join two more paths together using Minimum message length (MML).[15]Decision graphs have been further extended to allow for previously unstated new attributes to be learnt dynamically and used at different places within the graph.[16] The more general coding scheme results in better predictive accuracy and log-loss probabilistic scoring.[citation needed] In general, decision graphs infer models with fewer leaves than decision trees. Alternative search methods[edit]Evolutionary algorithms have been used to avoid local optimal decisions and search the decision tree space with little a priori bias.[17][18] It is also possible for a tree to be sampled using MCMC in a bayesian paradigm.[19] The tree can be searched for in a bottom-up fashion.[20] See also[edit]Implementations[edit] - Weka, a free and open-source data mining suite, contains many decision tree algorithms
- Orange, a free data mining software suite, module orngTree
- KNIME
- Microsoft SQL Server [1]
- scikit-learn, a free and open-source machine learning library for the Python programming language.
- R, an open source software environment for statistical computing which includes several CART implementations such as rpart, party and randomForest packages.
References[edit] - Jump up^ Rokach, Lior; Maimon, O. (2008). Data mining with decision trees: theory and applications. World Scientific Pub Co Inc.ISBN 978-9812771711.
- Jump up^ Quinlan, J. R., (1986). Induction of Decision Trees. Machine Learning 1: 81-106, Kluwer Academic Publishers
- ^ Jump up to:a b Breiman, Leo; Friedman, J. H., Olshen, R. A., & Stone, C. J. (1984). Classification and regression trees. Monterey, CA: Wadsworth & Brooks/Cole Advanced Books & Software. ISBN 978-0-412-04841-8.
- Jump up^ Breiman, L. (1996). Bagging Predictors. "Machine Learning, 24": pp. 123-140.
- Jump up^ Friedman, J. H. (1999). Stochastic gradient boosting. Stanford University.
- Jump up^ Hastie, T., Tibshirani, R., Friedman, J. H. (2001). The elements of statistical learning : Data mining, inference, and prediction. New York: Springer Verlag.
- Jump up^ Rodriguez, J.J. and Kuncheva, L.I. and Alonso, C.J. (2006), Rotation forest: A new classifier ensemble method, IEEE Transactions on Pattern Analysis and Machine Intelligence, 28(10):1619-1630.
- Jump up^ Kass, G. V. (1980). "An exploratory technique for investigating large quantities of categorical data". Applied Statistics 29(2): 119–127. doi:10.2307/2986296. JSTOR 2986296.
- Jump up^ Rokach, L.; Maimon, O. (2005). "Top-down induction of decision trees classifiers-a survey". IEEE Transactions on Systems, Man, and Cybernetics, Part C 35 (4): 476–487. doi:10.1109/TSMCC.2004.843247.
- Jump up^ Hyafil, Laurent; Rivest, RL (1976). "Constructing Optimal Binary Decision Trees is NP-complete". Information Processing Letters 5 (1): 15–17. doi:10.1016/0020-0190(76)90095-8.
- Jump up^ Murthy S. (1998). Automatic construction of decision trees from data: A multidisciplinary survey. Data Mining and Knowledge Discovery
- Jump up^ Principles of Data Mining. 2007. doi:10.1007/978-1-84628-766-4. ISBN 978-1-84628-765-7. edit
- Jump up^ Horváth, Tamás; Yamamoto, Akihiro, eds. (2003). Inductive Logic Programming. Lecture Notes in Computer Science2835. doi:10.1007/b13700. ISBN 978-3-540-20144-1. edit
- Jump up^ Deng,H.; Runger, G.; Tuv, E. (2011). "Bias of importance measures for multi-valued attributes and solutions". Proceedings of the 21st International Conference on Artificial Neural Networks (ICANN). pp. 293–300.
- Jump up^ http://citeseer.ist.psu.edu/oliver93decision.html
- Jump up^ Tan & Dowe (2003)
- Jump up^ Papagelis A., Kalles D.(2001). Breeding Decision Trees Using Evolutionary Techniques, Proceedings of the Eighteenth International Conference on Machine Learning, p.393-400, June 28-July 01, 2001
- Jump up^ Barros, Rodrigo C., Basgalupp, M. P., Carvalho, A. C. P. L. F., Freitas, Alex A. (2011). A Survey of Evolutionary Algorithms for Decision-Tree Induction. IEEE Transactions on Systems, Man and Cybernetics, Part C: Applications and Reviews, vol. 42, n. 3, p. 291-312, May 2012.
- Jump up^ Chipman, Hugh A., Edward I. George, and Robert E. McCulloch. "Bayesian CART model search." Journal of the American Statistical Association 93.443 (1998): 935-948.
- Jump up^ Barros R. C., Cerri R., Jaskowiak P. A., Carvalho, A. C. P. L. F., A bottom-up oblique decision tree induction algorithm. Proceedings of the 11th International Conference on Intelligent Systems Design and Applications (ISDA 2011).
External links[edit] |
+Citations (1) - CitationsAdd new citationList by: CiterankMapLink[1] Wikipedia
Author: Various
Cited by: Roger Yau 5:27 PM 19 October 2013 GMT
Citerank: (28) 291862AODE - Averaged one-dependence estimatorsAveraged one-dependence estimators (AODE) is a probabilistic classification learning technique. It was developed to address the attribute-independence problem of the popular naive Bayes classifier. It frequently develops substantially more accurate classifiers than naive Bayes at the cost of a modest increase in the amount of computation.109FDEF6, 291863Artificial neural networkIn computer science and related fields, artificial neural networks are computational models inspired by animal central nervous systems (in particular the brain) that are capable of machine learning and pattern recognition. They are usually presented as systems of interconnected "neurons" that can compute values from inputs by feeding information through the network.109FDEF6, 291936BackpropagationBackpropagation, an abbreviation for "backward propagation of errors", is a common method of training artificial neural networks. From a desired output, the network learns from many inputs, similar to the way a child learns to identify a dog from examples of dogs.109FDEF6, 291937Bayesian statisticsBayesian statistics is a subset of the field of statistics in which the evidence about the true state of the world is expressed in terms of degrees of belief or, more specifically, Bayesian probabilities. Such an interpretation is only one of a number of interpretations of probability and there are other statistical techniques that are not based on "degrees of belief".109FDEF6, 291938Naive Bayes classifierA naive Bayes classifier is a simple probabilistic classifier based on applying Bayes' theorem with strong (naive) independence assumptions. A more descriptive term for the underlying probability model would be "independent feature model". An overview of statistical classifiers is given in the article on Pattern recognition.109FDEF6, 291939Bayesian networkA Bayesian network, Bayes network, belief network, Bayes(ian) model or probabilistic directed acyclic graphical model is a probabilistic graphical model (a type of statistical model) that represents a set of random variables and their conditional dependencies via a directed acyclic graph (DAG). For example, a Bayesian network could represent the probabilistic relationships between diseases and symptoms. 109FDEF6, 291941Case-based reasoningCase-based reasoning (CBR), broadly construed, is the process of solving new problems based on the solutions of similar past problems. An auto mechanic who fixes an engine by recalling another car that exhibited similar symptoms is using case-based reasoning. So, too, an engineer copying working elements of nature (practicing biomimicry), is treating nature as a database of solutions to problems. Case-based reasoning is a prominent kind of analogy making.109FDEF6, 291943Inductive logic programmingInductive logic programming (ILP) is a subfield of machine learning which uses logic programming as a uniform representation for examples, background knowledge and hypotheses. Given an encoding of the known background knowledge and a set of examples represented as a logical database of facts, an ILP system will derive a hypothesised logic program which entails all the positive and none of the negative examples.109FDEF6, 291944Gaussian process regression (Kriging)Kriging is a method to build an approximation of a function from a set of evaluations of the function at a finite set of points. The method originates from the domain of geostatistics and is now widely used in the domain of spatial analysis and computer experiments. The technique is also known as Gaussian process regression, Kolmogorov Wiener prediction, or Best Linear Unbiased Prediction.109FDEF6, 291945Gene expression programmingGene expression programming (GEP) is an evolutionary algorithm that creates computer programs or models. These computer programs are complex tree structures that learn and adapt by changing their sizes, shapes, and composition, much like a living organism. And like living organisms, the computer programs of GEP are also encoded in simple linear chromosomes of fixed length. Thus, GEP is a genotype-phenotype system.109FDEF6, 291946Group method of data handlingGroup method of data handling (GMDH) is a family of inductive algorithms for computer-based mathematical modeling of multi-parametric datasets that features fully automatic structural and parametric optimization of models.109FDEF6, 291947Learning automataA branch of the theory of adaptive control is devoted to learning automata surveyed by Narendra and Thathachar which were originally described explicitly as finite state automata. Learning automata select their current action based on past experiences from the environment.109FDEF6, 291948Supervised learningSupervised learning is the machine learning task of inferring a function from labeled training data.[1] The training data consist of a set of training examples. In supervised learning, each example is a pair consisting of an input object (typically a vector) and a desired output value (also called the supervisory signal). A supervised learning algorithm analyzes the training data and produces an inferred function, which can be used for mapping new examples. 25CBCBFF, 291950Unsupervised learningIn machine learning, the problem of unsupervised learning is that of trying to find hidden structure in unlabeled data. Since the examples given to the learner are unlabeled, there is no error or reward signal to evaluate a potential solution. This distinguishes unsupervised learning from supervised learning and reinforcement learning.25CBCBFF, 291951Reinforcement learningReinforcement learning is an area of machine learning inspired by behaviorist psychology, concerned with how software agents ought to take actions in an environment so as to maximize some notion of cumulative reward. The problem, due to its generality, is studied in many other disciplines, such as game theory, control theory, operations research, information theory, simulation-based optimization, statistics, and genetic algorithms.25CBCBFF, 292450Hierarchical clusteringIn data mining, hierarchical clustering is a method of cluster analysis which seeks to build a hierarchy of clusters. Strategies for hierarchical clustering generally fall into two types:
Agglomerative: This is a "bottom up" approach: each observation starts in its own cluster, and pairs of clusters are merged as one moves up the hierarchy.
Divisive: This is a "top down" approach: all observations start in one cluster, and splits are performed recursively as one moves down the hierarch109FDEF6, 292451Association rule learningAssociation rule learning is a popular and well researched method for discovering interesting relations between variables in large databases. It is intended to identify strong rules discovered in databases using different measures of interestingness.109FDEF6, 292454Others25CBCBFF, 292455Learning Vector QuantizationIn computer science, Learning Vector Quantization (LVQ), is a prototype-based supervised classification algorithm. LVQ is the supervised counterpart of vector quantization systems.
LVQ can be understood as a special case of an artificial neural network, more precisely, it applies a winner-take-all Hebbian learning-based approach. It is a precursor to Self-organizing maps (SOM) and related to Neural gas, and to the k-Nearest Neighbor algorithm (k-NN). LVQ was invented by Teuvo Kohonen.109FDEF6, 292463Logistic Model TreeLMT is a classification model with an associated supervised training algorithm that combines logistic regression (LR) and decision tree learning. Logistic model trees are based on the earlier idea of a model tree: a decision tree that has linear regression models at its leaves to provide a piecewise linear regression model (where ordinary decision trees with constants at their leaves would produce a piecewise constant model).109FDEF6, 292464Minimum message lengthMinimum message length (MML) is a formal information theory restatement of Occam's Razor: even when models are not equal in goodness of fit accuracy to the observed data, the one generating the shortest overall message is more likely to be correct (where the message consists of a statement of the model, followed by a statement of data encoded concisely using that model). MML was invented by Chris Wallace, first appearing in the seminal (Wallace and Boulton, 1968).109FDEF6, 292465Lazy learningIn artificial intelligence, lazy learning is a learning method in which generalization beyond the training data is delayed until a query is made to the system, as opposed to in eager learning, where the system tries to generalize the training data before receiving queries.109FDEF6, 292466Instance-based learninginstance-based learning or memory-based learning is a family of learning algorithms that, instead of performing explicit generalization, compare new problem instances with instances seen in training, which have been stored in memory. Instance-based learning is a kind of lazy learning.109FDEF6, 292475k-nearest neighbor algorithmIn pattern recognition, the k-nearest neighbor algorithm (k-NN) is a non-parametric method for classifying objects based on closest training examples in the feature space. k-NN is a type of instance-based learning, or lazy learning where the function is only approximated locally and all computation is deferred until classification. 109FDEF6, 292476Analogical modelingAnalogical modeling (hereafter AM) is a formal theory of exemplar-based analogical reasoning, proposed by Royal Skousen, professor of Linguistics and English language at Brigham Young University in Provo, Utah. It is applicable to language modeling and other categorization tasks. Analogical modeling is related to connectionism and nearest neighbor approaches, in that it is data-based rather than abstraction-based.109FDEF6, 292478Probably approximately correct learningIn this framework, the learner receives samples and must select a generalization function (called the hypothesis) from a certain class of possible functions. The goal is that, with high probability (the "probably" part), the selected function will have low generalization error (the "approximately correct" part). The learner must be able to learn the concept given any arbitrary approximation ratio, probability of success, or distribution of the samples.109FDEF6, 292480Ripple-down rulesRipple Down Rules is a way of approaching knowledge acquisition. Knowledge acquisition refers to the transfer of knowledge from human experts to knowledge based systems.109FDEF6, 292481Support vector machinesIn machine learning, support vector machines (SVMs, also support vector networks[1]) are supervised learning models with associated learning algorithms that analyze data and recognize patterns, used for classification and regression analysis. 109FDEF6 URL: |
|
|