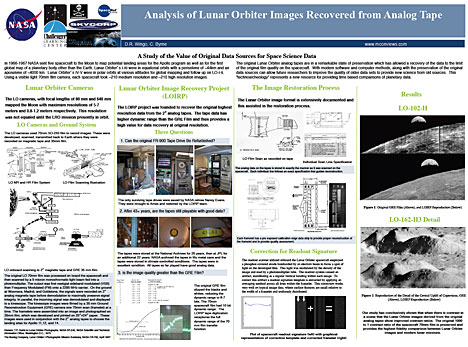
Researchers at scientific and academic conferences often make posters that use text and graphics to provide a brief summation of their work.

Inspired by this idea, we created a tool for mappers to create their own way to
summarize the conclusions of a map,
add a narrative layer over a map,
point to key aspects of map, and many other creative uses.

Each
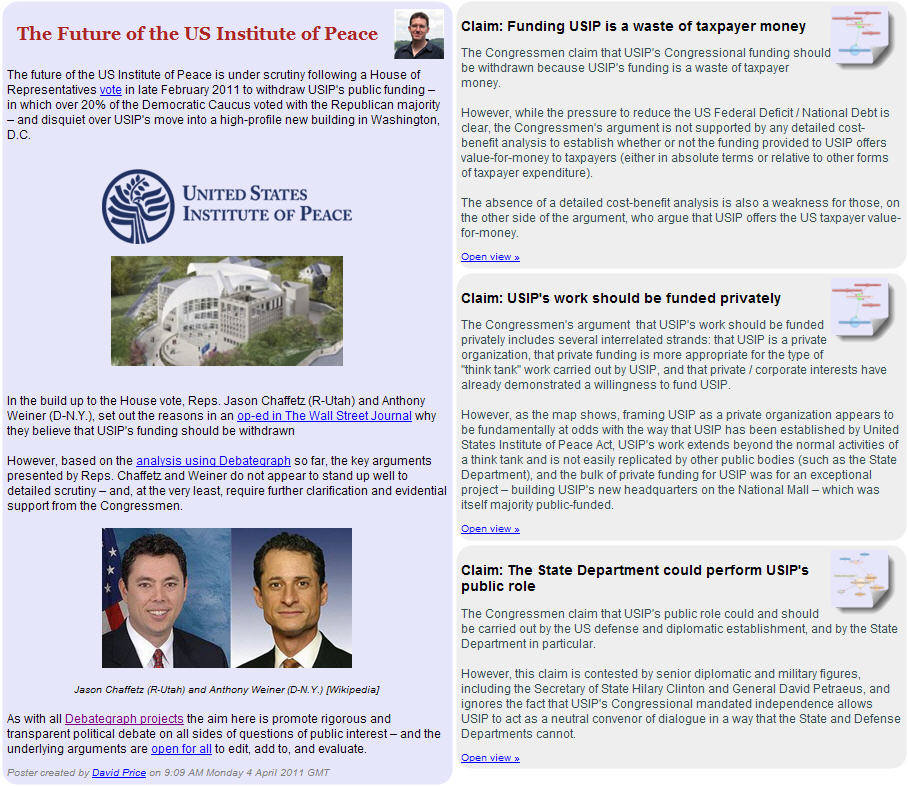
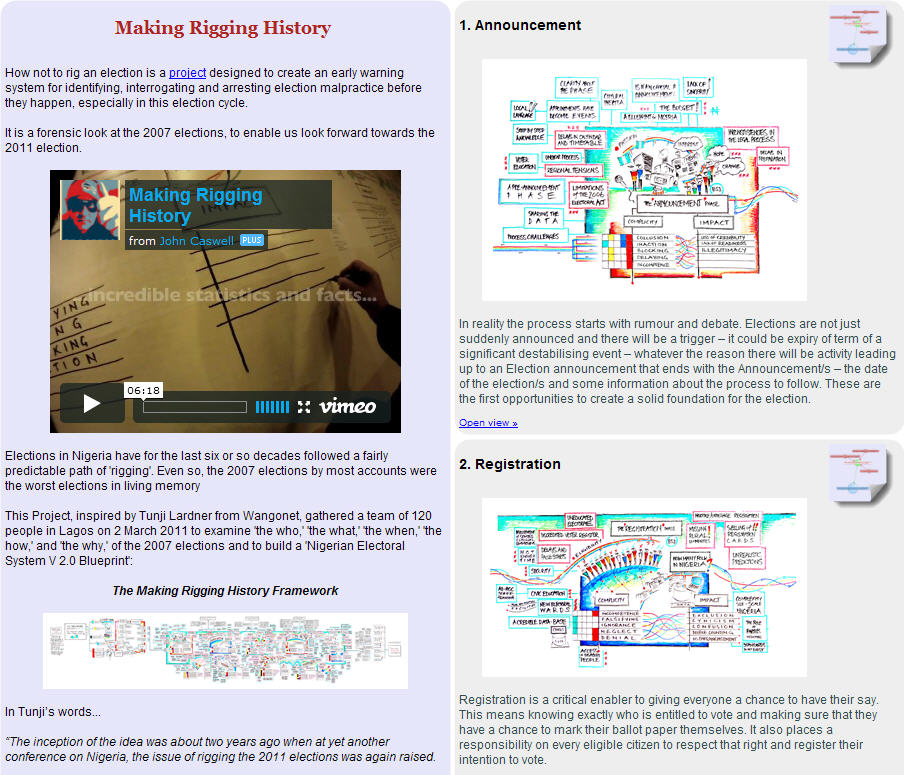
Poster consists of an Introduction (with a lavender background) and optionally one or more
Items (silver-grey background). The
Introduction and
Items can include text, videos and images and the
Items can arranged vertically and horizontally in two columns.
Optionally, an
Item can point to, and open, a specific view of a map – with an clickable icon identifying and launching the relevant view – and, when a
Poster points to one or maps, the
Poster is added automatically to the
Posters>> drop down menu for the relevant map(s), which is displayed beneath the map.
Posters also have their own URLs; so you can link to them directly to provide simple pathways into Debategraphs for readers who aren't familiar yet with this exciting new visual form.

You can find out more about
how to create your own Posters here.