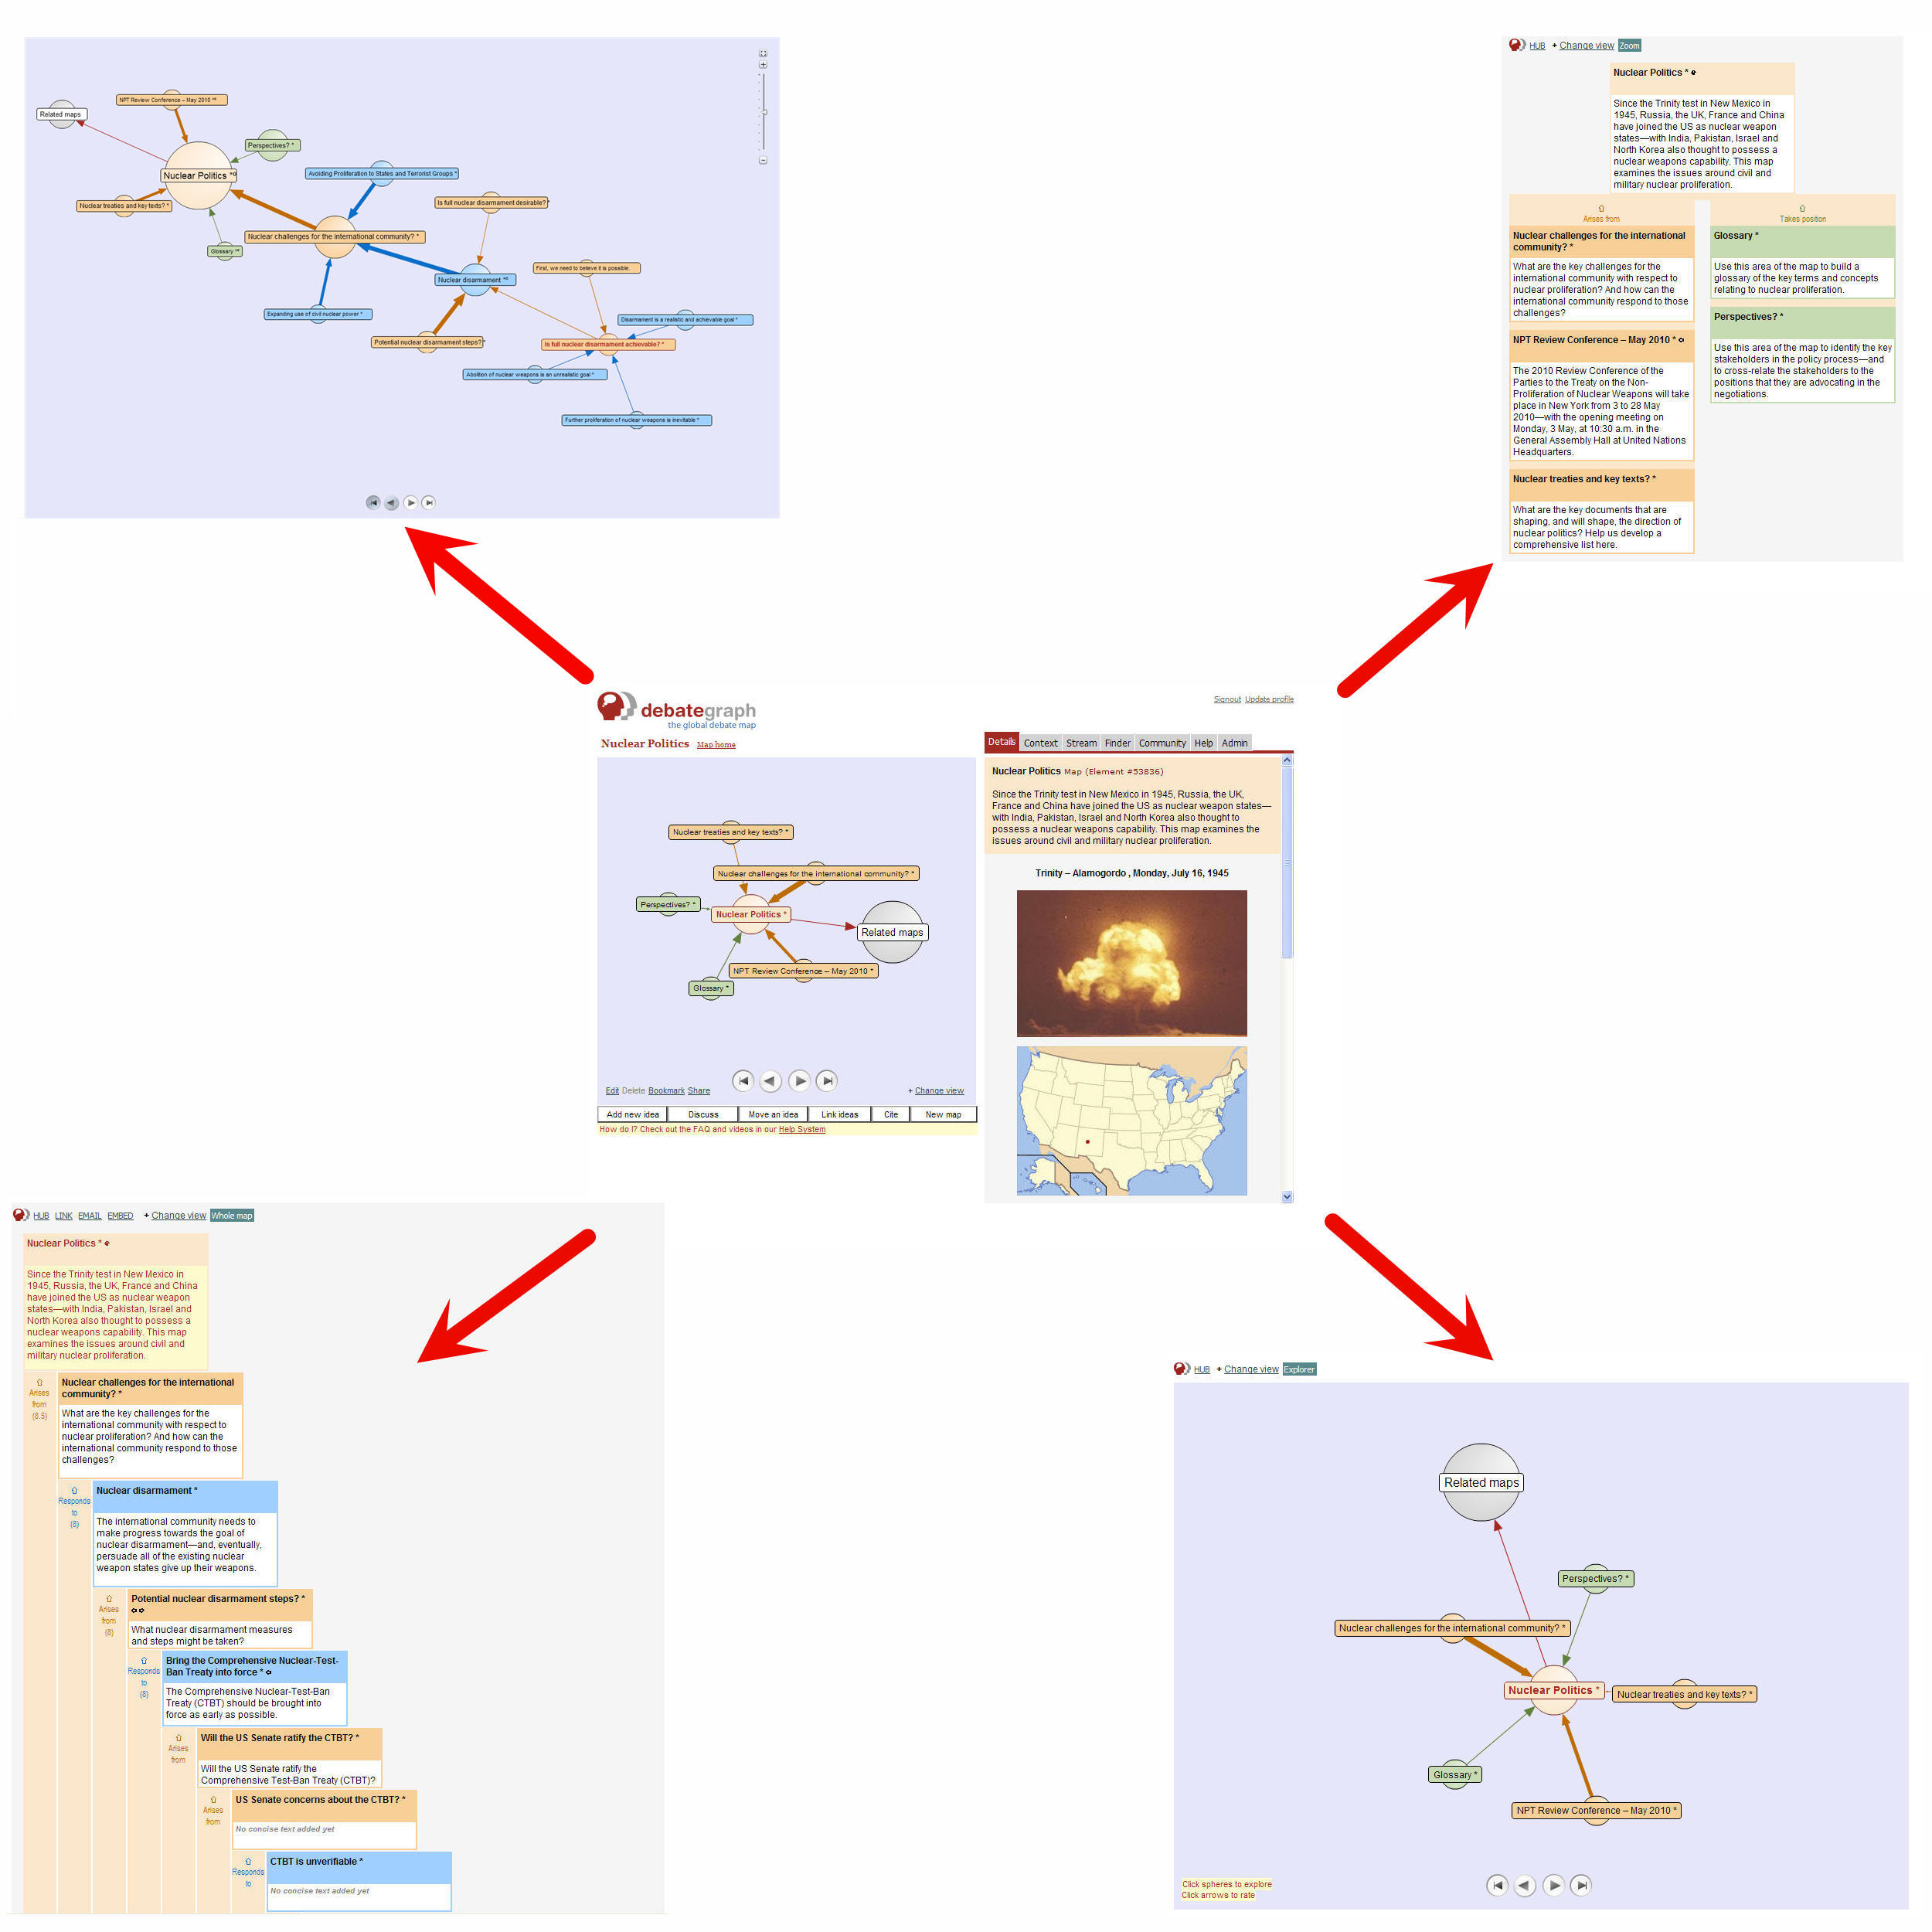
The + Change view menu lets you toggle between different visualizations of a map, parts of a map, or interconnected maps
Debategraph and debate mapping Debategraph is an application for building visualizations of complex debates and the relationships between them. It can, of course, be applied to other purposes – and we and others are discovering new uses all the time – nonetheless, the core design of Debategraph reflects this fundamental debate mapping purpose.
This has important implications for how we visualize information. Our goal is not to enable the arbitrary association of ideas, as with mind-mapping, but to foster the building of visualizations that support structured multi-party dialogue, sound argumentation and clear understanding of different points of view in complex controversies. We also aim to promote better understanding of the relationships between debates since with real-world controversies it is rarely the case that all the relevant factors can be brought to bear within the confines of a single debate map.
All the ideas depicted in a Debategraph map must fall into one of the allowed classes, or idea types, that constitute the
ontology for the map. Debategraph is designed to support multiple ontologies for different purposes: for example our integrated
Help System is a Debategraph map built using a special-purpose ontology. The
Home maps we have introduced recently also have their own ontology. Other ontologies can easily be developed for other purposes; for example, to reflect the nomenclature used in legal reasoning or risk management, or to reflect different argument representations schemas (such as that of Steven Toulmin). In Debategraph, an ontology is constituted by a set of idea types and a set of rules governing how they can combined to form maps – we sometimes refer to this combination as a
map grammar. The rationale for our current debate mapping ontology is described in a
separate article.
Maps, trees and 'the graph' Argument mapping is a skill taught in many courses in critical thinking and informal logic. In essence, it involves building
argument trees that depict the structure of inferences that support some conclusion. In a classic syllogism a conclusion is supported by a set of premises that, acting together, support the conclusion (from the premises 'All men are mortal' and 'Socrates is a man' it can validly be inferred that 'Socrates is mortal'). In real world debates things are never this simple. Each of the premises that support the main conclusion is a claim that may itself need to be supported. Hence we end up with a possibly very large
tree of such inferences with the main conclusion as the
root and the unsupported claims at the end of each branch described as
leaves. Such trees are typically represented diagrammatically as labeled circles or boxes connected by arrows representing the direction of inference. Done properly, such a depiction enables a clearer understanding of argument structure – as well as facilitating the detection of unsound argumentation (see
An argument is a tree of inferences by J. Mende).
Each Debategraph map has this tree-hierarchic structure, in which each element has a single 'parent' - except for the root of the map which is always the
Map element, and can have an arbitrary number of 'children'. Note that the relationships depicted are not just inferential - for example, a complex
Position taken in a debate can be decomposed into its C
omponent parts, in which case the relationship is one of composition rather than inference.
Debategraph data includes a 'forest' of such trees. However it also has a second layer of relationships that cut across the tree hierarchy - what we term
cross-links. Unlike the tree relationships, cross-links may connect elements in different maps. As with debate elements, each cross-link must be a member of a set of allowed link-types defined in the ontology. Each link-type has a prescribed semantic significance, and there are rules that govern the types of ideas that can be connected by each type. For example, one of the link-types is that of
Advocacy that can connect an idea of type
Protagonist to a position or argument. It would clearly make no sense to connect two positions with such a relationship.
When we refer to the whole
graph of debates we are referring to the forest of individual argument trees, interconnected by a web of cross-relations that cut across the tree hierarchies (a mathematical pedant might say that what we have is actually a
multigraph). These cross-relations can be thought of as 'worm holes' through the debate space - or more prosaically, as Tarzan-vines allowing travel around the forest canopy. Their purpose is to enable a broader understanding of relations both within and – crucially – between debates.
For an example about how cross-links spanning map boundaries can work, take the debate about the justifications for war. An argument made in the context of a debate about a specific war (Iraq, Afghanistan) may derive its authority from a broader ethical or theoretical framework about how, in general, a case for war should be assessed. If the argument refers to, say, the motives of those prosecuting the war, this may derive authority from
Just War Theory which holds that to be just a war must be motivated by 'right intention'. An alternative ethical theory, such as
Consequentialism - or the
Realist theory of international relations, on the other hand, would regard intention as intrinsically irrelevant. Clearly it is not practical to include all these complexities in a single debate map/tree. Our solution is to enable the connection of debates about generalities (how is war justified?) to specifics (is the Iraq war justified?) using a separate ontology of cross-link types, each with a defined semantic significance. In the example just given, the relation type to be used is
Grounding which asserts that a claim is grounded in a general principle (a bit like a
Toulmin warrant).
Grounding is one of twelve cross-relation types in our current debate-mapping ontology.
Visualizing Debategraph's molecular structure
In the Debategraph data structure, the most basic unit is the idea, or element, each of which is represented by a sphere (in flash views) or a box (in tree views) in our visualizations. We can think of each element as an 'atom' in the Debategraph molecular structure. To take the metaphor further, the three textual expressions - heading, concise summary, expanded text can be seen as the sub-atomic structure. Each element must be part of a tree (so, in graph-theoretic terms, when an element is added to a map a vertex is added along with a directed edge, depicted by an arrow, that relates the new element to its parent – by contrast a cross-link is just a directed edge).
If each idea/element is an atom, then the simplest 'molecule' is an element together with its parent, its children, and any elements that are cross-linked to it. This is what you see in the flash views that appear on the main working interface (
The Hub), and also in the enlarged
Explorer flash view.
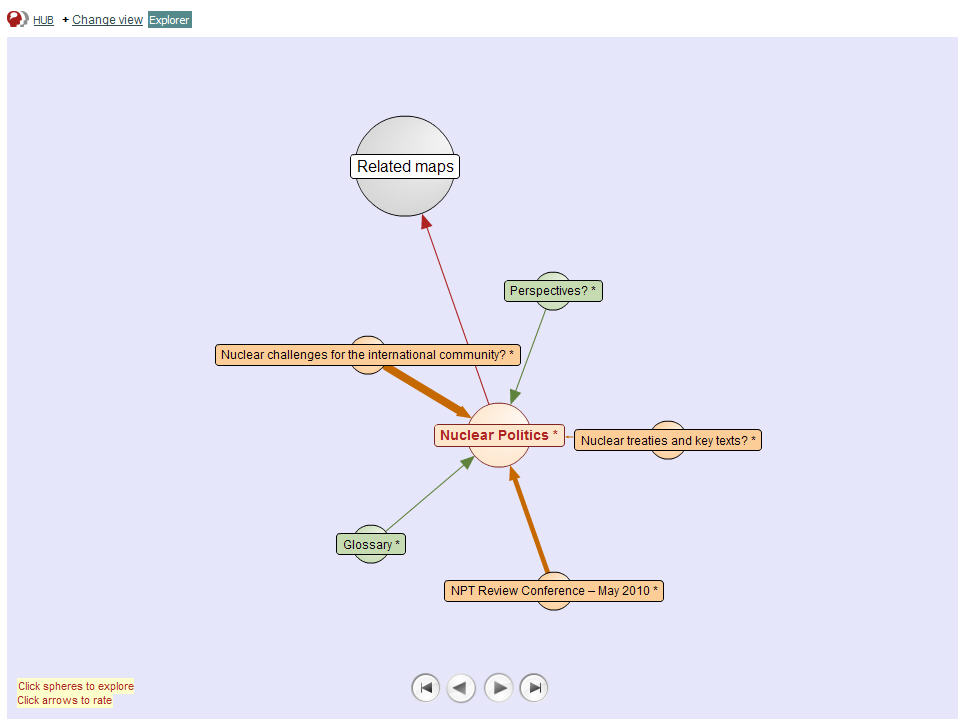
In these views, the tree structure is signaled using the relative sizes of the spheres: biggest for the parent, smallest for the children and cross-linked elements, intermediate size for the focus element. These relative sizes make for easy navigation up or down the tree. If the relationships are between premises and conclusions in an argument tree, this corresponds to an
inference in J. Mende's schema. We sometimes refer to the group of element/parent/children/cross-links as the element's
immediate context. As the user clicks spheres in the flash view (or on the
Context tree view - see below) the immediate context is reset with the clicked node as focus, enabling navigation around the map
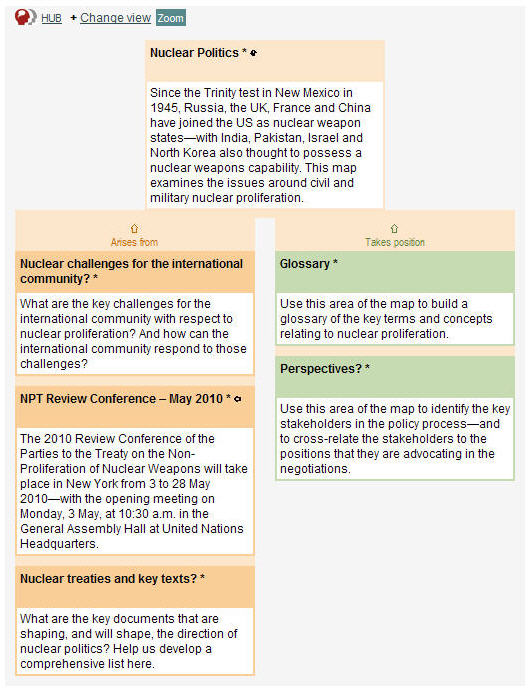
The same set of elements is displayed in the
Zoom view that can be selected from a +
Change view menu. However in this case the elements are displayed in a conventional top-down tree format, with children and cross-linked elements grouped into columns by type and ordered by average user rating.
Seeing an element together with the others that make up its immediate context is all very well - but how to get a sense of the larger context in a potentially very large map? There are two options:
- The Context tab in the main working interface (the Hub) shows the immediate context node embedded in an outline tree view of the whole map (for small to medium sized maps) or (for large maps) the immediate context nodes together with the ancestral path to the root of the tree. When elements in either the flash view or outline tree view are clicked the immediate context is reset.
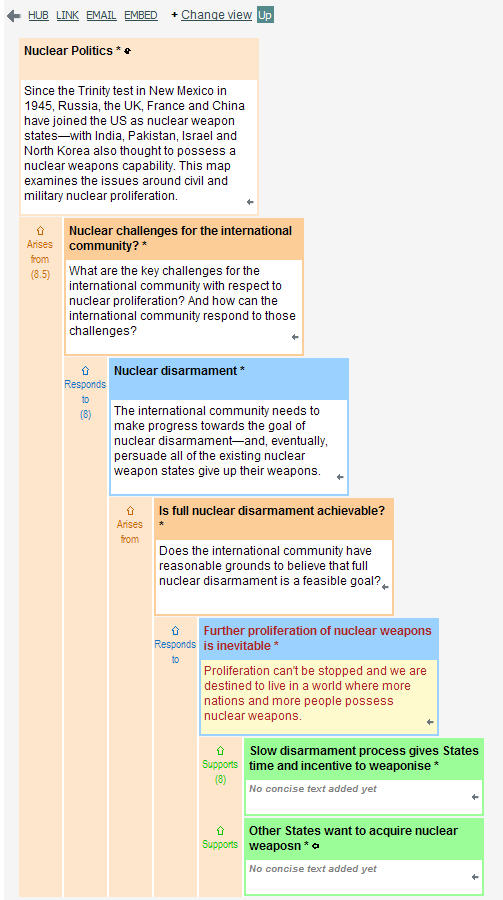
- The Tree/Up view, accessed from the Change view menu, shows the immediate context together with the ancestral path to the map root (i.e. the Map element) in an enlarged format that includes both label and summary text and that can be clicked to show full details about the clicked element on the right. 'Sibling' elements are joined by vertical channels that can be clicked to navigate up and down a large tree.
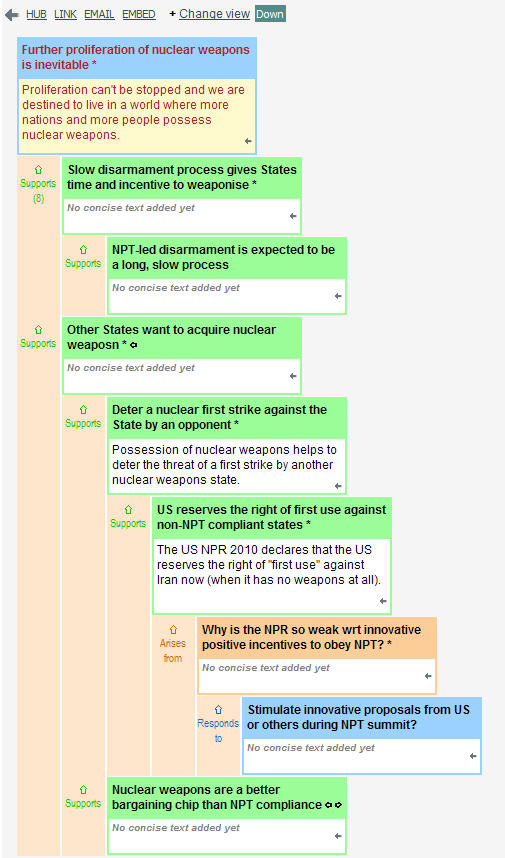
What about the larger molecules? A larger part of a map can be seen by displaying the Tree/Down view. This shows the selected element and its entire descendant subtree, again in an enlarged view with both heading and summary text, navigation channels, and complete details (possibly including a long expanded text) displayed on the right. With this view, an entire argument tree leading to an element can be viewed. An entire map, with perhaps thousands of elements, can be displayed in this format using the Tree/All view.
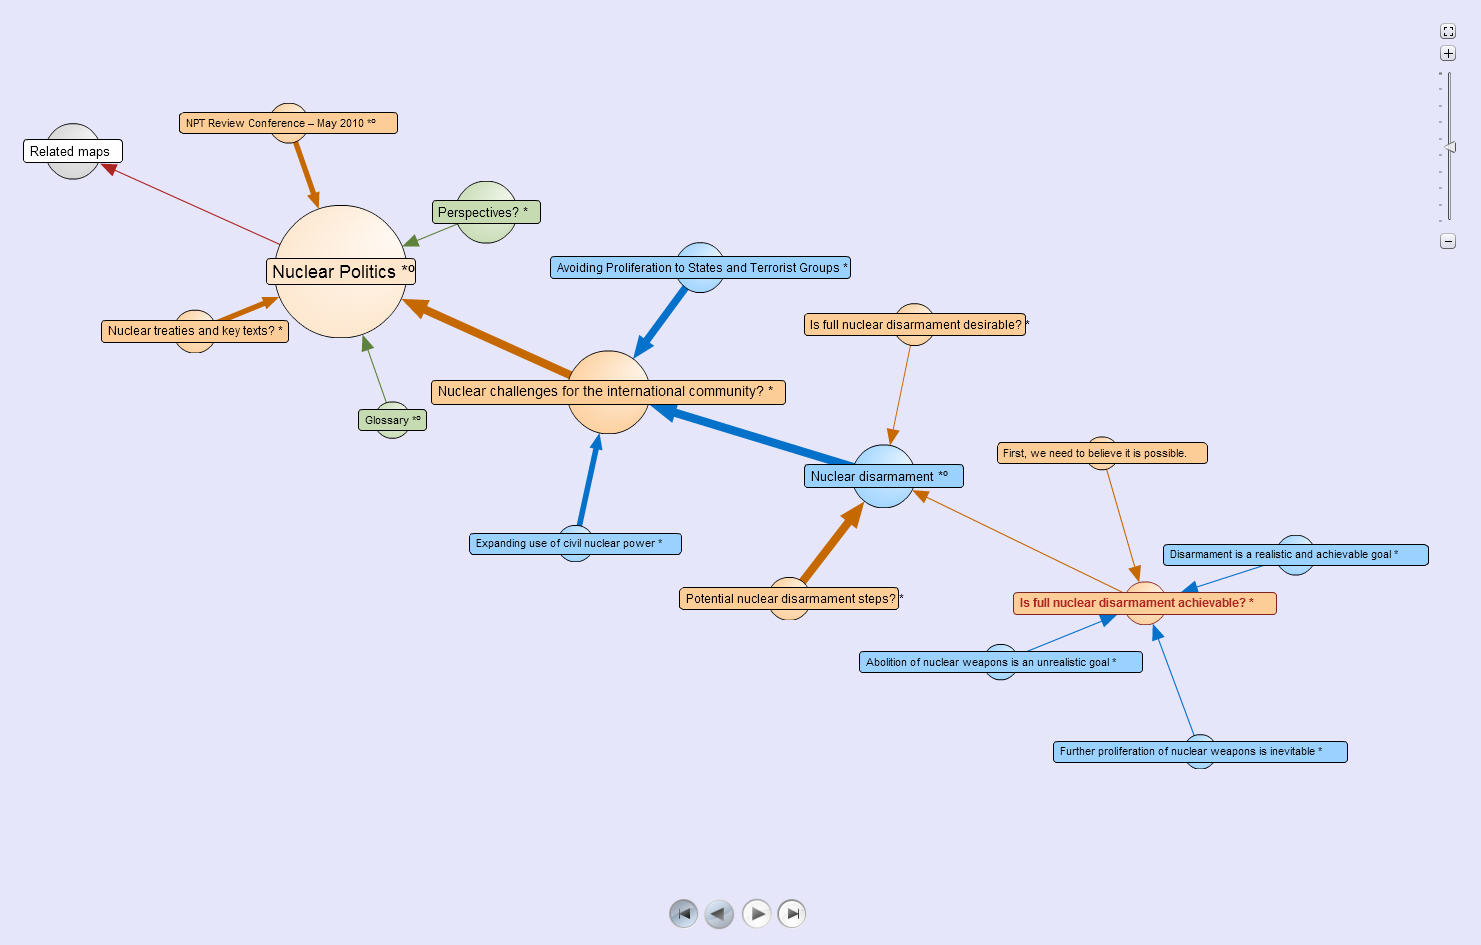
The biggest molecule of all is the graph of all the debates in the database - the Debategraph. Given this is now approaching 100,000 elements, it is clearly not possible to offer a meaningful picture of the whole shebang. However it is clearly desirable to be able to create a visualization that includes a selected subset of this larger graph - and a subset that is not confined to a single map (as with all the Tree views).
We have addressed this with the recently introduced Macro view. When this is selected from the Change view menu, what appears first is the immediate context of whatever is the current focus element (as with the other flash views). However unlike these, when the user clicks on an element, the new immediate context is loaded - but the elements previously displayed remain in view. By clicking elements in the map-tree, or elements connected to these by cross-links, the user can expand out part of a single map - or include in the same view parts of other maps, so that relations between debates can be studied. Unlike the other flash views, where sphere size is used to signal parent/selected/child relations, sphere sizes in the Macro view are scaled to the size of an elements subtree plus the number of cross-linked elements, providing a sense of where the action is in major debates.
Once the graph has been selectively expanded, the view can be saved under a friendly URL and easily returned to and shared with others - for example
this map that shows part of our main map about climate change together with a related part of a separate map about the Copenhagen conference.