| Help Resource0 #61936 A quick, interactive guide to DebateGraph (also available via the Help tab, top right). Click on the ideas here to learn more about each Help topic. |
.png)
Help...?
- DebateGraph offers a powerful way for people to collaborate in thinking through complex issues, decide what action to take, monitor and reflect on that action, and learn together iteratively.
- It does so by enabling groups of any size to externalise, visualize, question, and evaluate all of the considerations that anyone thinks might be relevant to the issues at hand – and by facilitating an intelligent, constructive, and iterative dialogue around those issues.
- As individuals, small teams, organizations, networks, or society as a whole, the ability to augment our individual capacity to choose wisely in the face of the complex, multi-dimensional problems we confront today is ever more pressing.
The basic building blocks of the maps
In essence, building the maps involves three steps: - breaking down the subject into meaningful ideas;
- figuring out the relationships between those ideas; and,
- expressing the ideas and relationships visually.
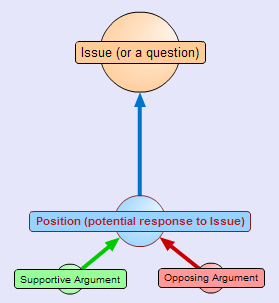
(Bubble view)
- Issues (or questions) are raised, Positions (or answers) suggested in response to these Issues, and Supportive and Opposing Arguments advanced for and against the Positions (and each other).
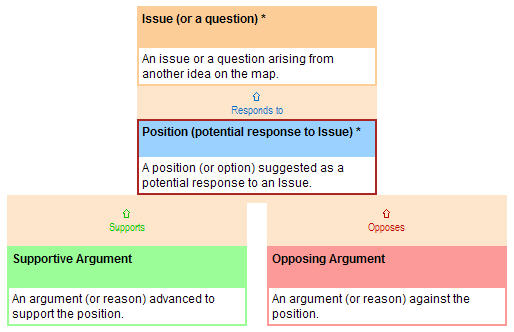
(Box view)
- Each building block has its own color to make it easier to see the types of ideas and relationships at a glance.
- There's a wider set of building blocks beyond the three core ones, but the core set of Issues, Positions, and Supportive and Opposing Arguments can be combined and recombined many times to build rich maps on any scale.
|