- The Views menu (above) lets you toggle between different visualizations of the map or parts of the map – with each type of view having specific strengths and uses (described below). You can also vary the behavior of each View type via the Options menu.
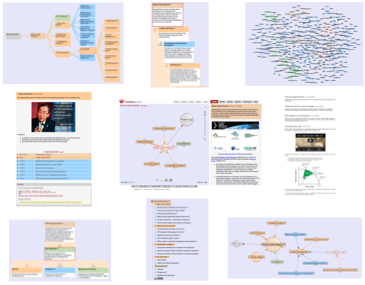
THE BUBBLE VIEWS The Bubble views let you browse quickly and dynamically through the structure of a map, and are designed to help you develop an initial feel for the content of the map and of the web of relationships between clusters of connected maps. The arrows connecting ideas become thicker as the average rating of the relationship increases.
1. Bubble > Focus The
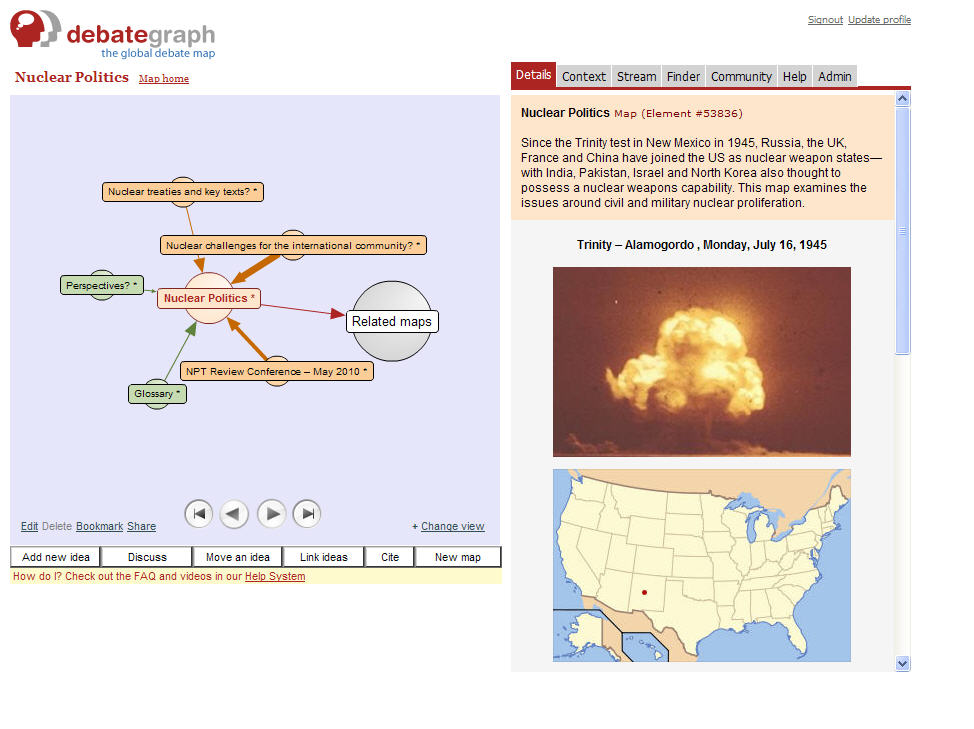
Bubble > Focus view is the standard home view of the map, and shows the immediate context of the currently selected idea. The heading of the selected idea is highlighted with red text against a white background, and the smaller bubbles take you deeper into the map and the bigger bubble lets you navigate back up to the top of the map.
The
Detailed text of the selected idea is displayed on the
Details tab to the right, which updates as you navigate around the map and can be hidden using the Tab link in the bottom right corner of the map. You can also zoom in and out using the
Zoom controls (top right on the map) and pan around the view (by dragging in the space between ideas).
2. Bubble > Expanding
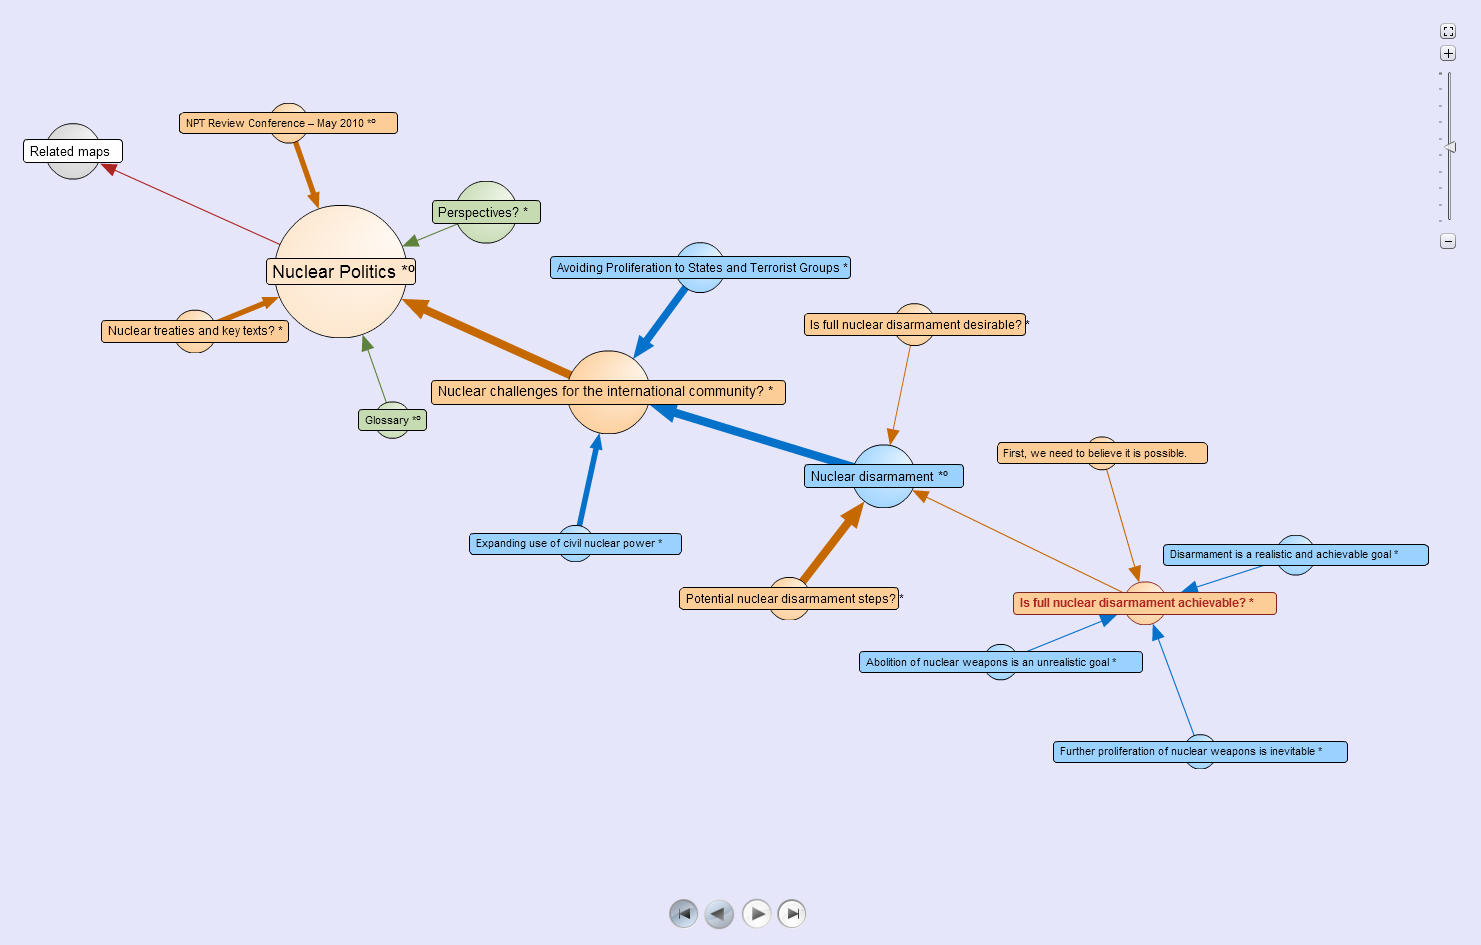
The Bubble > Expanding view opens the same set of ideas as the Focus view; however as you click on the bubbles the branches of the map open cumulatively (so that you can see the wider context). You can Refocus the view on the currently selected idea at any time – to clear the cumulative context – and the relative size of the bubbles signals the relative depth of the underlying branch.
4. Bubble > All
The
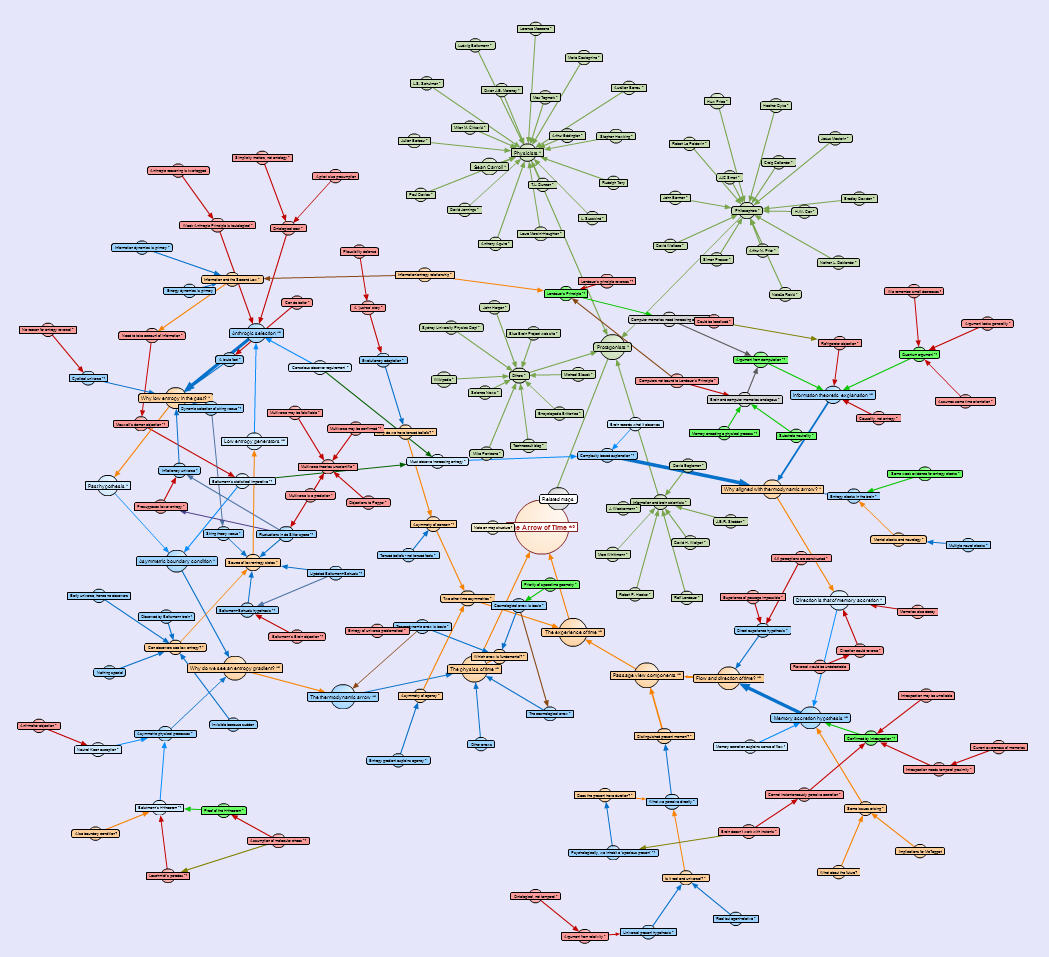
Bubble > All view opens the entire map in the bubble format (for maps that have up to 600 ideas).
(
Note: this viewing option is disabled automatically once maps grow beyond 600 ideas – as some computers struggle to process the large-scale dynamic graphs).
THE TREE VIEWS
1.
Tree > Focus
The
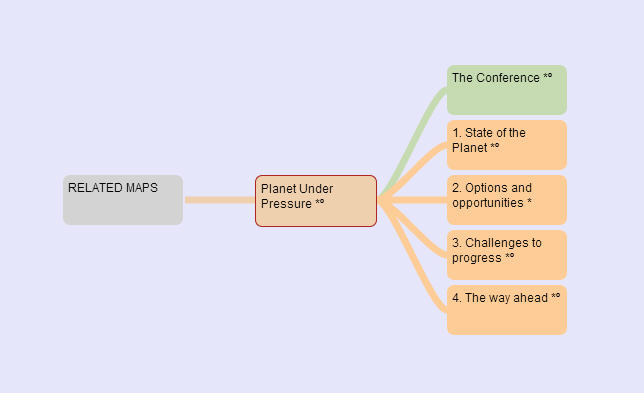
Tree > Focus view shows the same set of ideas as the
Bubble > Focus view – and clicking on the ideas allows you to navigate within and between maps in the same way. You can also drag the set of ideas displayed in the Tree view by clicking and dragging in the background space between the ideas, and re-orient the view between a left-to-right and top-to-bottom format using the Orient link in the bottom right corner of the map.
2. Tree > Expanding
When navigating in the
Tree > Expanding view, the branches of the map open either progressively (by default) or cumulatively (after clicking on the Toggle collapse mode on the
Options menu). Branches of the tree can also be
Collapsed or
Pruned using the options available on the Tree view right-click context menu.
3. Tree > Down
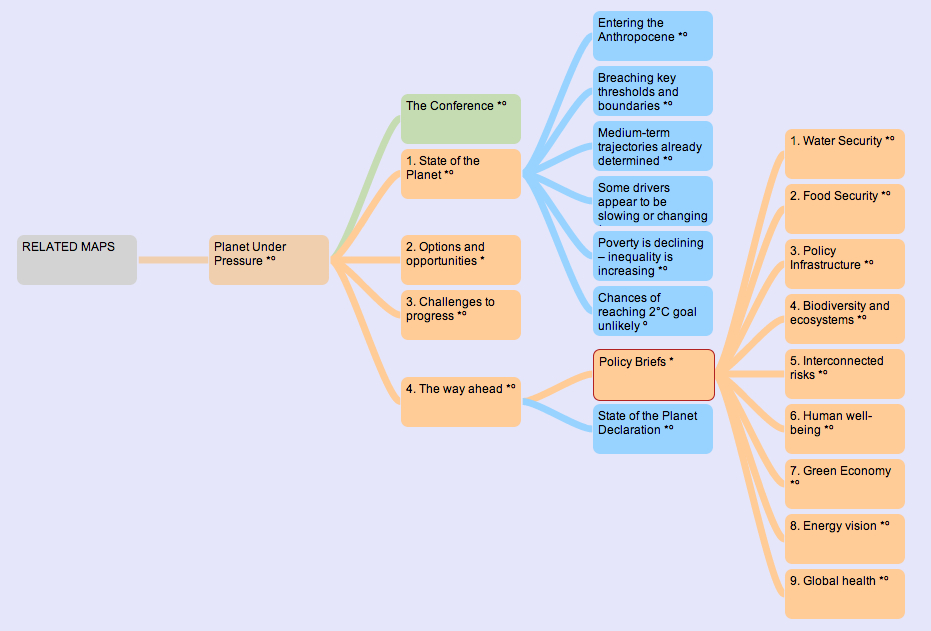
The Tree > Down view displays all of the ideas that stem down from the currently selected idea...

...and you can Zoom out, change the Orientation from Left => Right to Top => Down (using the Orient link at the bottom right of the map), and hide the Tabs (to increase the viewing area) using the Tabs link (also located at the the bottom right of the map
3. Tree > All
The
Tree > All view displays the whole map in either the
Left => Right or T
op => Down orientation.
THE RADIAL VIEWS
The
Radial views offer the same set of options as the
Tree views for exploring and sharing a map – and the
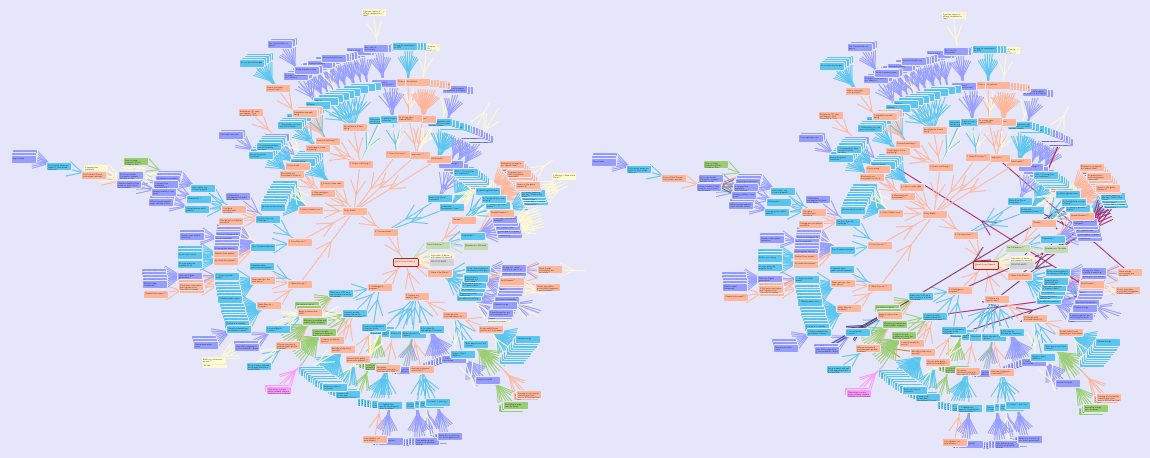
Radial > All view offers a particularly useful way to gain a quick overview of the structure of a larger map.

The Options > Cross-links > Connect all option also lets you display and follow the cross-links within the currently selected map (illustrated above, right).
THE BOX VIEWSThe Box views present – and let you examine and explore – the maps in a more reflective and analytical way. The positioning and stacking of the boxes makes it easy to follow the structure of an argument and, where applicable, the highest rated ideas are displayed at the top of the relevant column.
1. Box > Focus
The
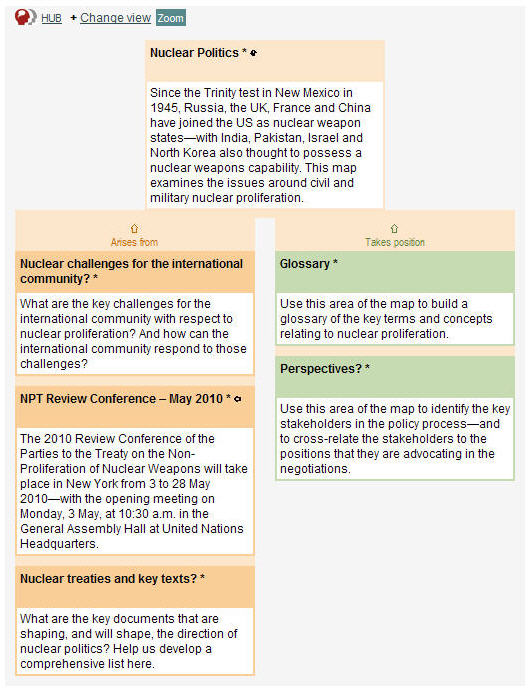
Box > Focus view displays the same set of ideas as the
Bubble > Focus view, but with the ideas presented as boxes organized in columns by idea type and rating (in either a
Horizontal or
Vertical format – selected via the
Orient link in the bottom right corner of the map). The
Heading and
Summary text are shown in the boxes with the
Detailed text to right, and you can navigate through the entire map by double-clicking on the boxes..
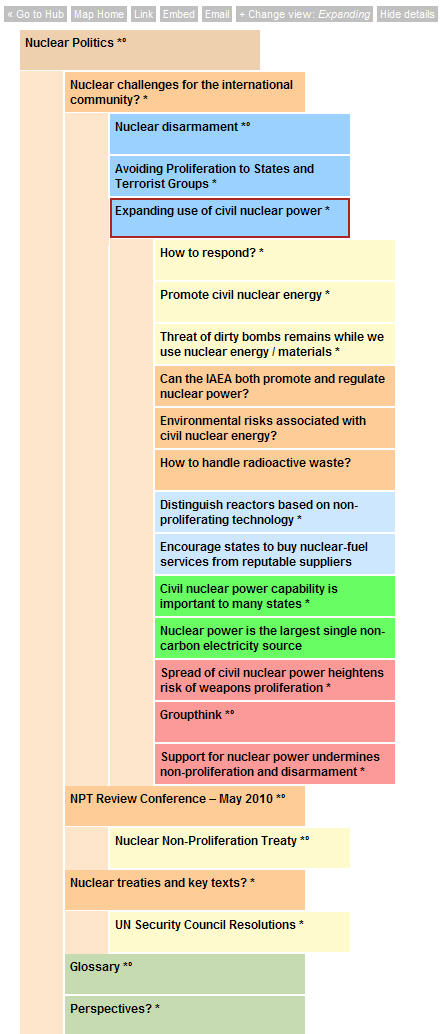
2. Box > Expanding
The Box > Expanding view the same set of ideas as the Bubble > Focus view in a vertical format, but expands to show more ideas progressively as you double-click on the ideas. This view is particularly useful for exploring the wider context around the currently selected idea – and, as with all of the vertically oriented Box views, you can choose to Show or Hide the summary text in the view (using the Show / Hide summaries option on the Options menu).
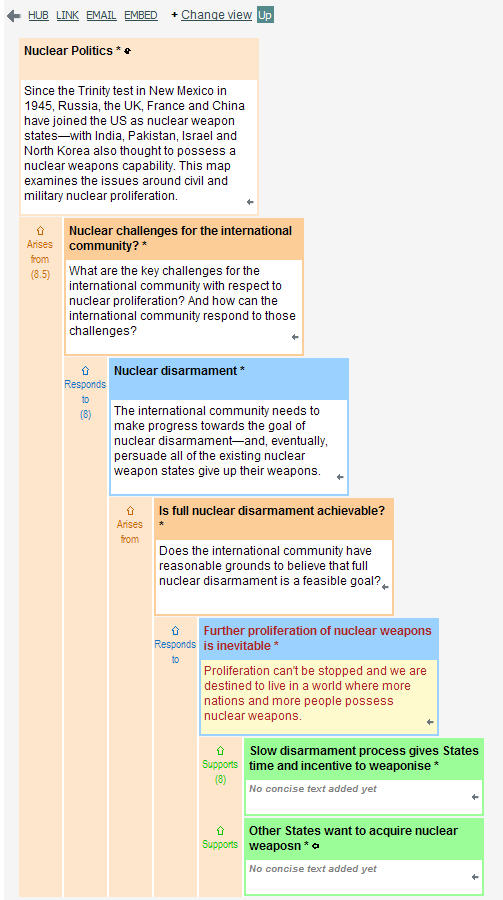
3. Box > Up
The Box > Up view displays the thread of an argument – the breadcrumb trail – up from the selected idea to the top of the map. This view is particularly useful when you want to check the logic of an argument and/or want to remind yourself of your current location on the map. It also shows the children of the selected idea to give you a fuller sense of your immediate context.
Clicking on an idea box changes the Details displayed to the right, and double clicking on idea box refocuses the Up view on the idea selected by the double click.
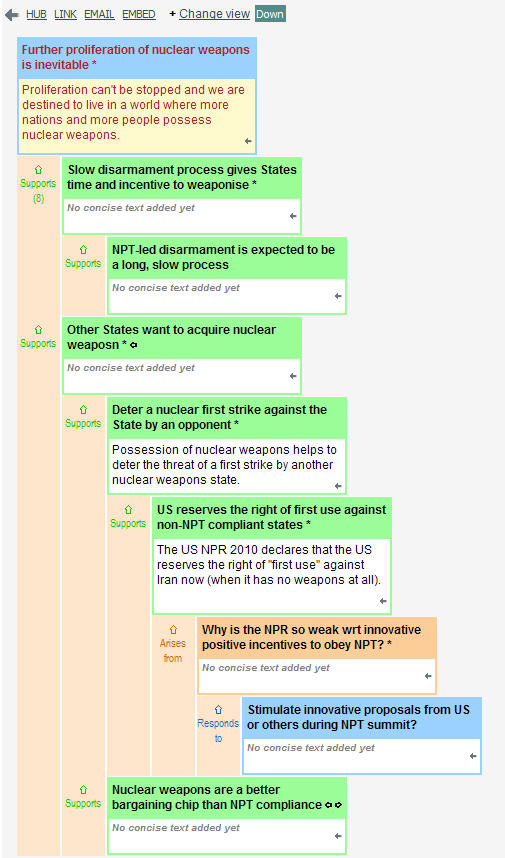
4. Box > Down
The Box > Down view displays all the ideas that underpin the currently selected idea – that is, its children, its children's children, and their children and so on – in an expanded outline format in which the idea boxes are stacked vertically by idea type and descending order of average rating. This view is particularly useful when you want to analyze a specific branch of a map in isolation from the rest of the map.
5. Box > All
The Box > All view displays all the ideas in the current map – in an expanded outline format in which the idea boxes are stacked vertically by idea type and in descending order of average rating – and, on opening, scrolls automatically to the selected (last clicked) idea.
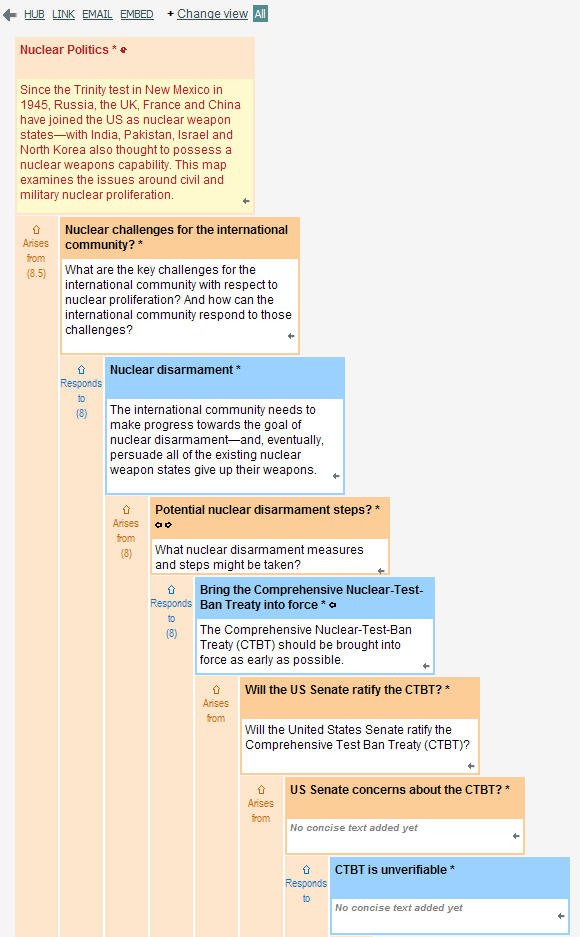
In the Box > All view (and the Up and Down views) pink columns join ideas that relate to the same parent idea. Clicking in and/or rolling over the columns lets you navigate within the currently selected view, and you can choose to Hide or Show the Details tab and/or the Summary text.
THE OUTLINE VIEW
You can use the Outline tab in combination with the Bubble, Box and Tree views to see the wider context and breadcrumb trail to the top of the map from your current location – and toggle the Outline to the left (using the bottom of the Outline tab – or the Outline option on the Views menu) to see the Outline in combination with the Details view.
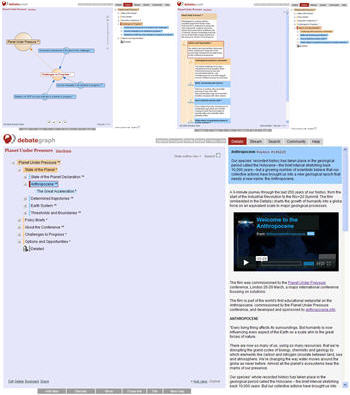
You can also expand a collapsed Outline to view the entire map by click in the Expand check box (and uncheck the box to collapse a fully expanded Outline).
THE DOCUMENT VIEW
The Document view (which map creators can enable via check bock on the Manage this map panel on Community tab) displays all the current content of the map in document / report based format that can be saved and opened in a word processor.
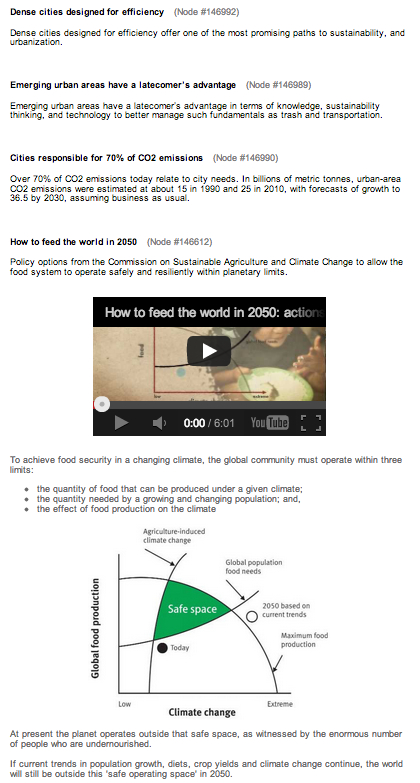
A side-menu in the Document view lets you return to the map in the current location in the document and also gives you the option edit the currently selected idea in the Document view.
THE PAGE VIEW
The Page view shows all the information added to an idea so far, in a simple web page format – including the idea's heading, summary, detailed text, images, videos, ratings, citations and comments etc – and lets you explore the graph of related ideas simply by clicking the color-coded and structured links displayed at the bottom:
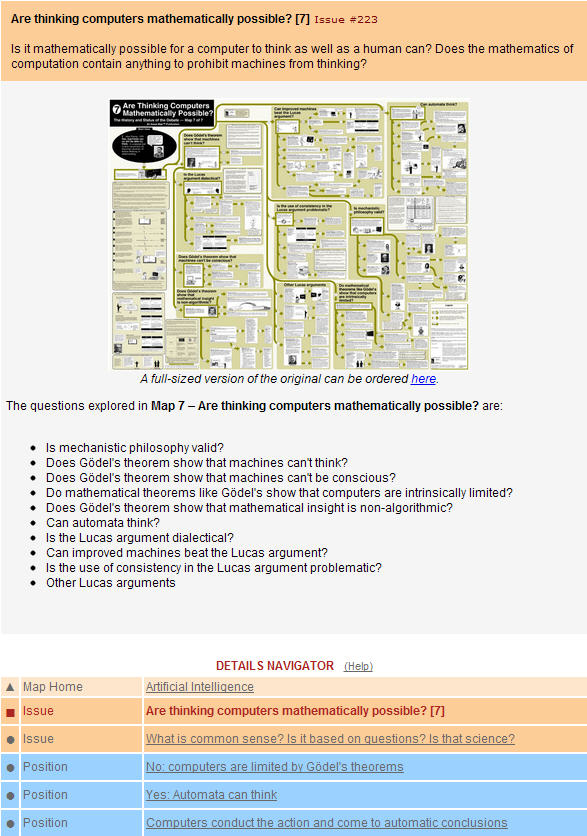
The Page view is also ideally suited to smart phone displays (e.g. iPhone and Android) .
Note: In each of the views, cross-linked ideas are displayed with a pale-yellow color (and can be used to navigate within and between maps).