The Current Structure of the Maps
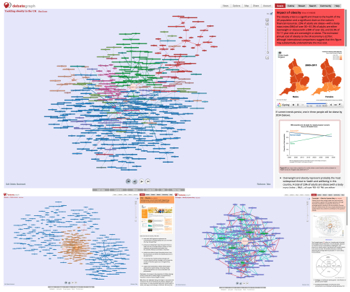
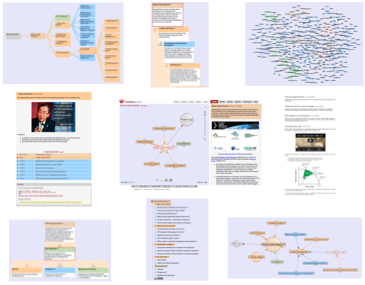
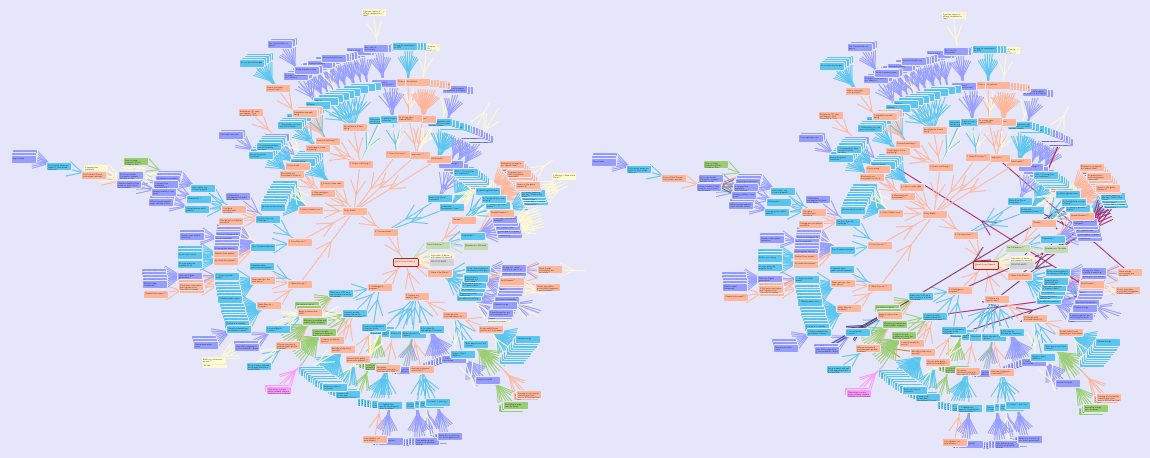
The current work-in-progress is presented as a cluster of three interlinked maps: (1) The main obesity policy discussion map, (2) the map of the obesity policy stakeholders, and (3) the map of the Foresight systems model:

Although the scale of the mapping can seem overwhelming at first—particularly if you are new to DebateGraph—DebateGraph gives us a way to explore and deepen our understanding of the policy space through small manageable steps.
This process isn't effortless—it involves learning how to use DebateGraph and taking the time explore the maps—but it delivers high rewards:
(1) Exploring the map is a highly efficient way of deepening your understanding: the mapping team has spent hundreds of hours mapping and inter-linking a vast body of evidence and reports to develop insights that you can grasp in a few hours of exploration.
(2) The complexity of the obesity challenge is not infinite; just of a sufficient degree that it's difficult for us to hold and process it as a whole in our minds: DebateGraph helps us overcome this cognitive limitation by allowing us to externalise and work through this structure from our own starting point at our own pace.
(3) Moreover, this externalised structure isn't just the parts that are in our heads, it interweaves the disparate parts that are in many heads and allows us to see them as a coherent whole.
(4) The maps are living structures that continue to evolve and reshape as more people share their knowledge and insights and as more evidence emerges, and, once you have a feel for the structure of the map, it becomes almost effortless to keep with this process and to recognise the contextual significance of new information.
DebateGraph is also fun to play with, but it's not a toy: it has been designed by policy makers for policy makers to enhance our understanding systemic and network governance – and it has been used by the UK Prime Minister's Office, the White House Office of Science and Technology Policy, and the European Commission.
Exploring the maps
The Views menu (above) lets you toggle between different visualizations of the map or parts of the map – with each type of view having specific strengths and uses. You can also vary the behavior of each View type using the Options menu.


Contributing to the Map
There are various ways in which you can contribute to the development of the current map:
(1) Add a Comment to an idea, by clicking on the Comment button under the map. The process is just the same as commenting on a blog. Your comment will also appear in the Map activity stream and in the email digests to the Map community.
(2) Add a Citation to an idea, using either the Cite button (beneath the map) or the Cite radio button underneath the Details text. Citations are one of the easiest and most useful contributions you can make to a map; as they tell the map community about articles elsewhere on the web that you think are relevant to a particular idea and/or that contain ideas that you think should be added to the map.
(3) Add a new idea to the map by navigating to the relevant part of the map and then clicking on the Add idea button (beneath the map in the Hub view). Prior to adding a new idea, it's generally worth exploring the map and using the Search this map facility on the Finder tab to check whether the idea is included elsewhere on the map already. When adding a new idea, it's always fine to use the default Issue idea type (although you are also welcome to change the idea type using the color selector beneath the idea text entry box – and the idea selector will always guide you as to the types of idea that are available in any given location).
(4) Rate an idea, either by clicking on the Rating scale shown at the bottom of the Details text or by clicking on the arrow that points from the idea to its parent (which opens a small version of the rating scale on the map). Rating ideas in this way helps the community to see which ideas are perceived to be the most important (and why).
(5) You can also Edit an existing idea – for example, to correct a typo, to clarify or improve the text, to change the idea type, or to add more details to the Details text – either by clicking on the small Edit link (bottom left on the map in the Hub view) or by clicking on the Edit details link (at the bottom of the Details text). Each idea has a full Edit history; so you can always revert to an earlier version of the idea at any time.
...and each of these ways of contributing to a map is explained in more detail in its own section of the
Help tab.