|
![]()
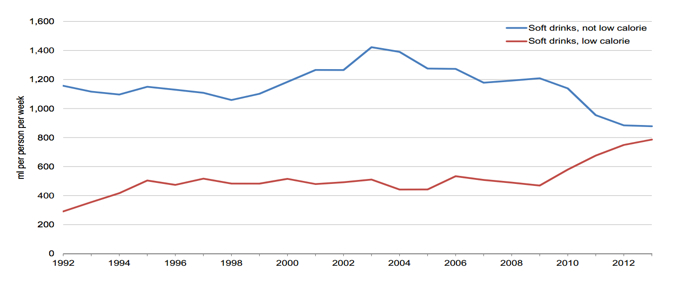
| UK purchases of not-low calorie soft drinks are falling OpposingArgument1 #371569 Household purchases of soft drinks were 3.1 per cent lower in 2013 compared to 2010, a fall of 54 grams per person per week. Within this category, household purchases of ‘not low calorie soft drinks’ are on a downward trend since 2010 and fell by 23 per cent between 2010 and 2013 from 1139 to 878 grams per person per week. | UK purchases of soft drink (concentrated and unconcentrated), 1992–2013 
Source: DEFRA - This was mirrored by an upward trend in ‘low calorie soft drinks’ with household purchases 36 per cent higher in the same period up from 579 to 786 grams per person per week.
|
+Citations (1) - CitationsAdd new citationList by: CiterankMapLink[1] Family Food 2013
Author: Department for Environment, Food and Rural Affairs
Publication info: 2014 December, 11
Cited by: David Price 11:18 PM 4 January 2015 GMT
Citerank: (14) 349166Department for Environment, Food & Rural AffairsDEFRA is the UK government department responsible for policy and regulations on environmental, food and rural issues.58D3ABAB, 352778Use subsidies to encourage healthier choicesGovernment food subsidies should promote healthier food ranges (eg fruit/vegetables).565CA4D9, 371565Long term downward trend in total energy intake from all food & drinkTotal energy intake per person was an average of 2192 kcal per person per day in 2012, 4.4 per cent lower than in 2010. This is a statistically significant downward trend that confirms the longer term downward trend already apparent since the mid 1960s.648CC79C, 371566Intake around 5% higher than Estimated Average Requirement for adultsTotal energy intake from all food and drink is around 5 per cent higher than the Estimated Average Requirement for adult intakes.648CC79C, 371567Eatwell plate comparison for low income and all householdsHousehold food purchases do not generally match the Government recommended Eatwell plate proportions of the types of food which make up a well balanced diet. Both low income households and all households have a relatively similar diet in terms of the Eatwell Plate categories.648CC79C, 371567Eatwell plate comparison for low income and all householdsHousehold food purchases do not generally match the Government recommended Eatwell plate proportions of the types of food which make up a well balanced diet. Both low income households and all households have a relatively similar diet in terms of the Eatwell Plate categories.648CC79C, 371568Eating out accounts for only around 10% of average energy intakeThe average energy intake from eating out accounts for only around 10 per cent of total energy intake. The total energy intake per person was an average of 2192 kcal per person per day in 2012, and the energy intake from eating out was 220 kcal per person per day in 2013.648CC79C, 399726Use subsidies to encourage healthier choicesGoverrnment food subsidies should promote healthier food ranges (eg fruit/vegetables).565CA4D9, 399786Eating out accounts for only around 10% of average energy intakeThe average energy intake from eating out accounts for only around 10 per cent of total energy intake. The total energy intake per person was an average of 2192 kcal per person per day in 2012, and the energy intake from eating out was 220 kcal per person per day in 2013.648CC79C, 399854Eatwell plate comparison for low income and all householdsHousehold food purchases do not generally match the Government recommended Eatwell plate proportions of the types of food which make up a well balanced diet. Both low income households and all households have a relatively similar diet in terms of the Eatwell Plate categories.648CC79C, 399854Eatwell plate comparison for low income and all householdsHousehold food purchases do not generally match the Government recommended Eatwell plate proportions of the types of food which make up a well balanced diet. Both low income households and all households have a relatively similar diet in terms of the Eatwell Plate categories.648CC79C, 399938Long term downward trend in total energy intake from all food & drinkTotal energy intake per person was an average of 2192 kcal per person per day in 2012, 4.4 per cent lower than in 2010. This is a statistically significant downward trend that confirms the longer term downward trend already apparent since the mid 1960s.648CC79C, 399939Intake around 5% higher than Estimated Average Requirement for adultsTotal energy intake from all food and drink is around 5 per cent higher than the Estimated Average Requirement for adult intakes.648CC79C, 399969UK purchases of not-low calorie soft drinks are fallingHousehold purchases of soft drinks were 3.1 per cent lower in 2013 compared to 2010, a fall of 54 grams per person per week. Within this category, household purchases of ‘not low calorie soft drinks’ are on a downward trend since 2010 and fell by 23 per cent between 2010 and 2013 from 1139 to 878 grams per person per week.13EF597B URL:
|
|
|