Anthropogenic Climate Change
Mapping the causes, consequences and potential responses to climate change.
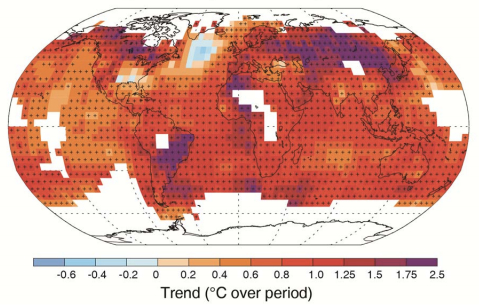
Observed change in average surface temperature 1901 – 2012
This map grew out of an online collective intelligence project, ESSENCE – organized by DebateGraph, the Open University and MIT and supported by the World Federation of UN Associations and The Independent newspaper – in the build up to the United Nation’s Climate Change Conference in Copenhagen in December 2009.
The structure of the map – which is continuing to evolve – is like a wiki; every aspect is mutable provisional, and open to further refinement, and anyone can add new issues, positions, arguments and evidence to the map.
The aim is to weave together the key scientific and political arguments into a rich, transparent, multi-dimensional structure that anyone can explore quickly to gain a broad understanding of the complex considerations and choices that humanity faces on climate change and a range of systemically interrelated issues. Through collaborative and iterative community input, every perspective can be represented fairly, succinctly and in full.
So where you spot gaps, or incorrect and/or unchallenged arguments on the map, please help us to fill the gaps and correct and challenge the arguments.
Each element on the map can be cross-related to any other element on the map; so any point can be seen in the context of any other point. And each element is described not only via the heading and roll-over text shown in the visualization above, but also via an expanded text that can include images and other media.