A. Child nutritional status in Northern Nigeria
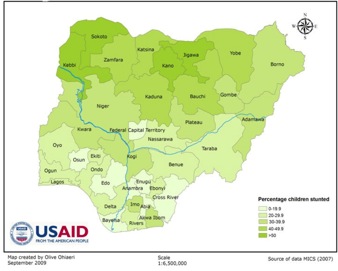
Data shows that nutritional problems of under fives remain severe. All surveys confirm that stunting consistently exceeds 50% (except for some seasonal variations in some states), well in excess of the national average. There are no clear trends that the situation is improving.
Figure 1: Prevalence of stunting:

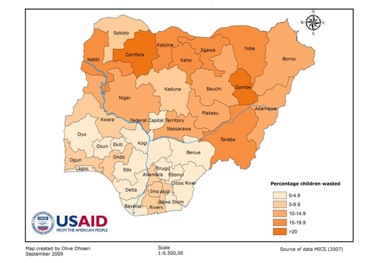
Figure 2: Distribution of Prevalence of Wasted Children by State:

(Both figures courtesy of Hall, A. and Bohen, C. (2009) A Review of Malnutrition in Nigeria and the Potential Role of Homestead Agriculture to Improve the Nutritional Status and Income of Poor Rural People)
There have been five major national surveys from which estimations of child nutritional status could be drawn; these are NDHS, 1990, NDHS, 2003, MICS, 2007, NDHS, 2008 and MICS, 2012. The Nigeria Food Consumption and Nutrition Survey of 2001-2003 sampled data from Kebbi, only one of the five WINNN states.
At the time of writing, the authors did not have access to the MICS (2012) surveys, but the review includes three Smart surveys which cover the five states, the latest of which was published in February 2012. In addition, generally there are two other sources of survey data: one off small scale research investigations which provide data at a village or multi village level, and some rapid surveys carried out, mostly by NGOs.
Summary of Child Nutritional Status (data source: NDHS, 2008):
- The average prevalence in the NW States of stunting, wasting and underweight is 52.6%, 19.9% and 35.1% respectively compared to the national averages of 40.6%, 13.9% and 23.3% respectively.
- The Northwest states include 41% of all stunted children in Nigeria, 48% of all wasted children and 51% of all underweight children.
- 24% of all stunted children in Nigeria, and 32% of all wasted and 33% of all underweight children live in the priority states.
- The priority states hold 28% of all severely stunted children, 31% of all severely wasted children and 35% of all severely underweight children in Nigeria, being 1.8m, 0.6m and 0.9m respectively.
- The NDHS data shows a slow rate of progress: between 2003 and 2008, nationally, the rate of stunting fell from 42.4% to 40.6% and the underweight rate fell from 24.3% to 23.1%.
- There are 586,470 children with severe acute malnutrition in the five programme states, so assuming a case fatality rate of 10% means that 58,000 of these children will die by their fifth birthday.
There is some disparity between the MICS 2007 and the NDHS 2008 in terms of their malnutrition data. Many factors, such as timing of the survey, can influence the results, but in some instances there are 10% differences between state estimates.
An important issue here is that more recent studies use the new WHO standards, which could have led to the different results. But despite these issues of clarification, it is clear that malnutrition remains serious a serious problem in the five states studied.