Network Analysis - Understanding Impact
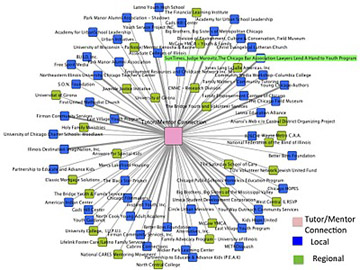
We've been inviting people to come to conferences every six months since 1994. More than 1000 organizations have been represented at least one time. We've recently been trying to map this using SNA tools.
Social Network Analysis is an emerging science that enables us to understand who we are connected to and to use that knowledge to connect people in more strategic ways. Tutor/Mentor Institute has been trying to apply this to understanding its impact based on how many people have been connected to each other because of the work we do.

This map can be seen in
this blog showing maps made from 2008 and 2009 conferences.
This forum is where we've been coaching interns to make these maps for the Tutor/Mentor Institute.
While we'd like to find interns and researchers interested in working directly with us on this project, the Debategraph maps could be used to not only frame a discussion, but to show the network of people who are participating in an event or a discussion.
If you attend the Chicago conference or join the conference discussion via Debategraph or another forum just add a new node
to this graph, with a picture and introduction to yourself.
Not only will be have a way for people who know who is in the conversation but for people to connect with others who they are interested in meeting and working with as a result of hosting the conference and discussion.