Whe

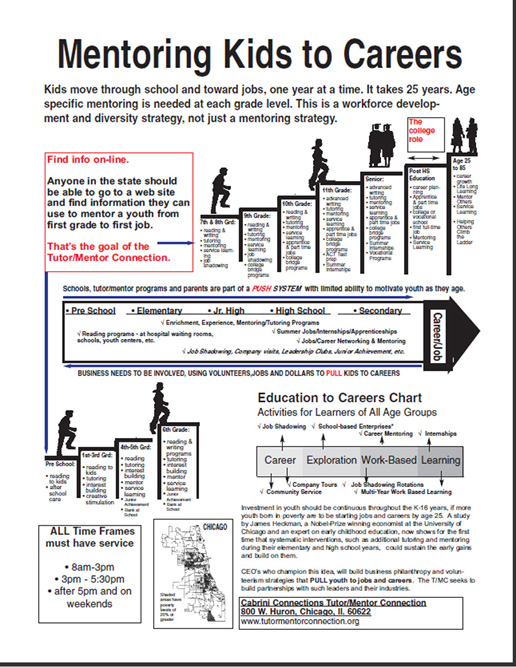
n a public leader says "I want to help every youth in my city get a quality education" does a visualization like this pop up on your mental image screen? This emphasizes the 12 years from entering elementary school to high school graduation and that additional years of schooling or vocational education are needed before the youth reached the mid-20s.
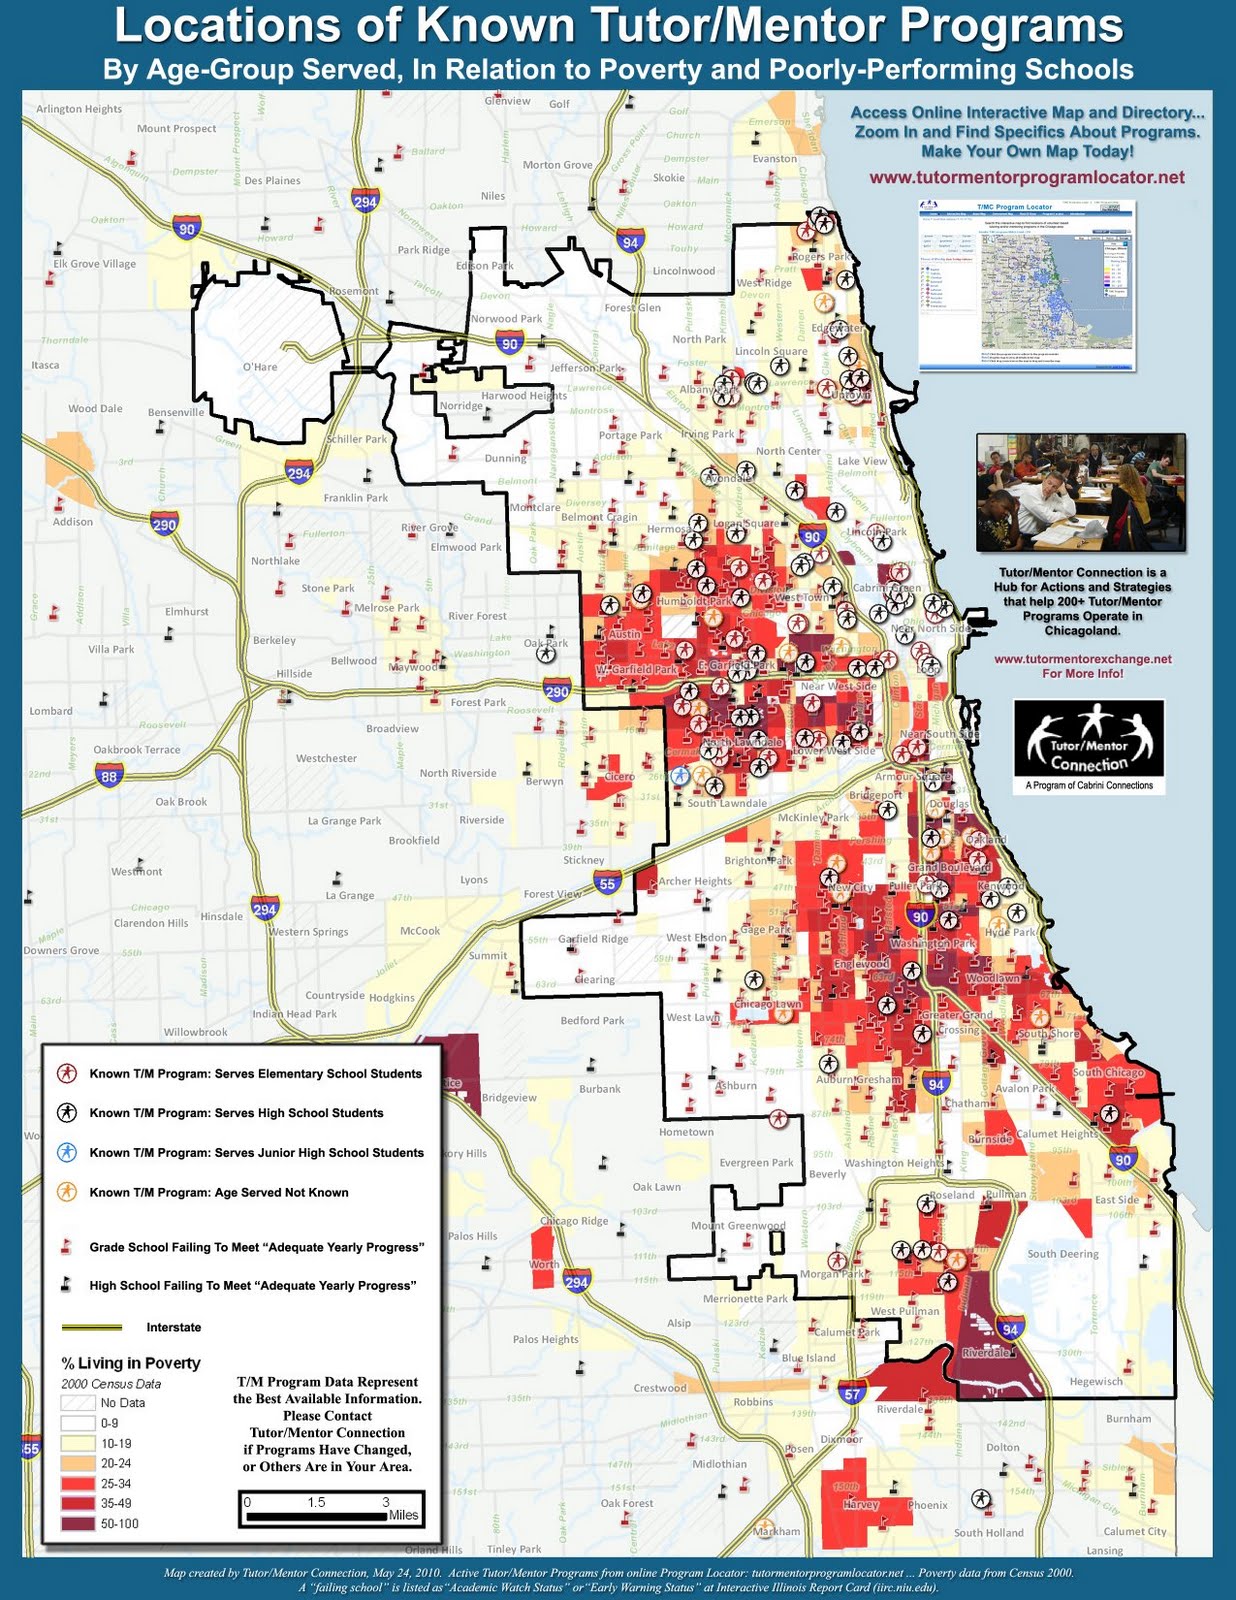
There is a map in this graphic. It comes from a
gallery of maps created by the Tutor/Mentor Institute and Tutor/Mentor Connection since 1993. These maps have overlays showing areas of highest poverty concentrations along with locations of schools considered to be "under-performing" based on performance of students on standardized test.
The maps are intended to motivate leaders to develop strategies that provide learning supports to youth in every poverty neighborhood rather than just a few high profile neighborhoods. The charts are intended to show that such programs need to be consistently supported for decades, not just with 2-3 year grant cycles or one-time donations.
To the right is one of the maps from the gallery.

On this map are icons representing locations of volunteer-based tutoring and/or mentoring programs that operate in the non-school hours. Using an
Interactive Program locator users can sort this map by age-group served and type of program to build an understanding of the availability of such programs in different parts of the city.
Our purpose in starting this page is to share thinking that would lead to a better distribution of constantly improving tutor/mentor programs in more places of Chicago and the application of this strategy in more cities around the world.